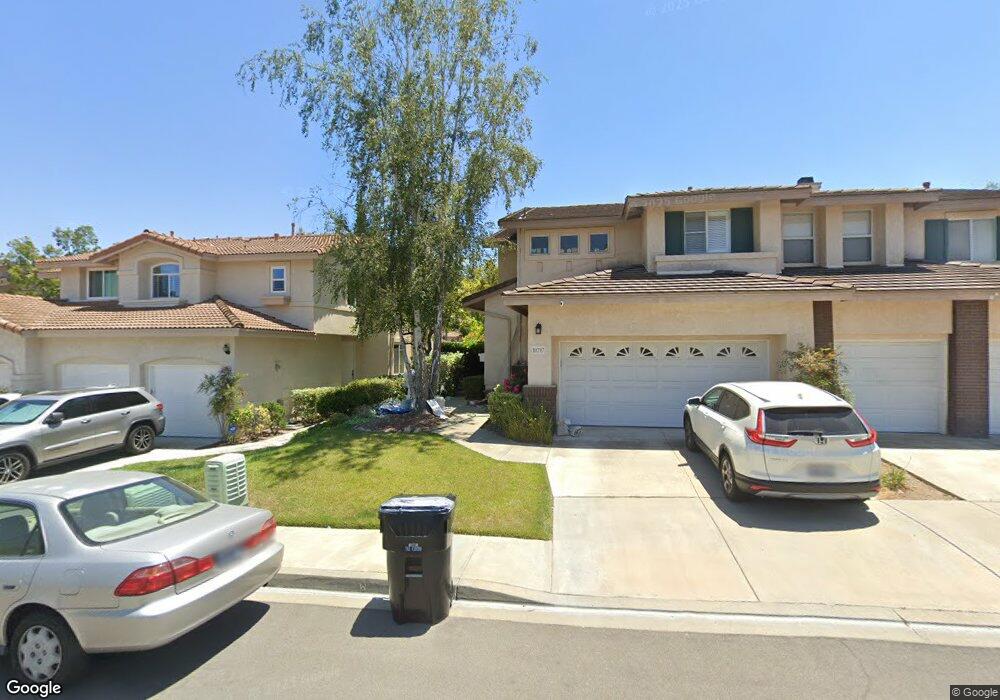
10717 Ballystock Ct Unit 4A San Diego, CA 92131
Miramar Ranch North NeighborhoodEstimated Value: $1,187,000 - $1,374,000
3
Beds
3
Baths
1,674
Sq Ft
$749/Sq Ft
Est. Value
About This Home
This home is located at 10717 Ballystock Ct Unit 4A, San Diego, CA 92131 and is currently estimated at $1,253,087, approximately $748 per square foot. 10717 Ballystock Ct Unit 4A is a home located in San Diego County with nearby schools including Dingeman Elementary School, Thurgood Marshall Middle School, and Scripps Ranch High School.
Ownership History
Date
Name
Owned For
Owner Type
Purchase Details
Closed on
Feb 28, 2011
Sold by
Deshmukh Hemant M and Deshmukh Anuja H
Bought by
Deshmukh Hemant M and Deshmukh Anuja H
Current Estimated Value
Home Financials for this Owner
Home Financials are based on the most recent Mortgage that was taken out on this home.
Original Mortgage
$147,000
Outstanding Balance
$6,749
Interest Rate
4.71%
Mortgage Type
New Conventional
Estimated Equity
$1,246,338
Purchase Details
Closed on
Feb 7, 2002
Sold by
Cowles Vicki Lynn and Cowles Steven F
Bought by
Deshmukh Hemant M and Muzumdar Anuja S
Home Financials for this Owner
Home Financials are based on the most recent Mortgage that was taken out on this home.
Original Mortgage
$282,400
Outstanding Balance
$110,063
Interest Rate
6.25%
Estimated Equity
$1,143,024
Purchase Details
Closed on
May 25, 1994
Sold by
D R Horton Inc
Bought by
Cowles Steven F and Cowles Vicki Lynn
Home Financials for this Owner
Home Financials are based on the most recent Mortgage that was taken out on this home.
Original Mortgage
$183,998
Interest Rate
8.3%
Mortgage Type
VA
Create a Home Valuation Report for This Property
The Home Valuation Report is an in-depth analysis detailing your home's value as well as a comparison with similar homes in the area
Home Values in the Area
Average Home Value in this Area
Purchase History
| Date | Buyer | Sale Price | Title Company |
|---|---|---|---|
| Deshmukh Hemant M | -- | First American Title Company | |
| Deshmukh Hemant M | $353,000 | Fidelity National Title | |
| Cowles Steven F | $180,500 | Chicago Title Co |
Source: Public Records
Mortgage History
| Date | Status | Borrower | Loan Amount |
|---|---|---|---|
| Open | Deshmukh Hemant M | $147,000 | |
| Open | Deshmukh Hemant M | $282,400 | |
| Previous Owner | Cowles Steven F | $183,998 | |
| Closed | Deshmukh Hemant M | $35,300 |
Source: Public Records
Tax History Compared to Growth
Tax History
| Year | Tax Paid | Tax Assessment Tax Assessment Total Assessment is a certain percentage of the fair market value that is determined by local assessors to be the total taxable value of land and additions on the property. | Land | Improvement |
|---|---|---|---|---|
| 2025 | $6,611 | $521,464 | $216,911 | $304,553 |
| 2024 | $6,611 | $511,240 | $212,658 | $298,582 |
| 2023 | $6,453 | $501,217 | $208,489 | $292,728 |
| 2022 | $6,217 | $491,390 | $204,401 | $286,989 |
| 2021 | $6,161 | $481,756 | $200,394 | $281,362 |
| 2020 | $6,089 | $476,817 | $198,340 | $278,477 |
| 2019 | $5,959 | $467,468 | $194,451 | $273,017 |
| 2018 | $6,484 | $458,303 | $190,639 | $267,664 |
| 2017 | $6,366 | $449,317 | $186,901 | $262,416 |
| 2016 | $6,283 | $440,508 | $183,237 | $257,271 |
| 2015 | $6,206 | $433,892 | $180,485 | $253,407 |
| 2014 | $6,118 | $425,394 | $176,950 | $248,444 |
Source: Public Records
Map
Nearby Homes
- 10818 Caminito Arcada
- 11629 Swan Lake Dr Unit 4
- 10941 Waterton Rd
- 10914 Ivy Hill Dr Unit 1
- 11482 Cortina Place
- 11365 Affinity Ct Unit 192
- 11215 Affinity Ct Unit 80
- 9960 Scripps Vista Way Unit 116
- 11825 Miro Cir
- 11856 Miro Cir
- 11265 Affinity Ct Unit 103
- 11175 Affinity Ct Unit 45
- 11235 Affinity Ct Unit 68
- 11115 Affinity Ct Unit 1
- 11325 Affinity Ct Unit 151
- 12490 Heatherton Ct Unit 8
- 9819 Kika Ct
- 12530 Heatherton Ct Unit 31
- 10978 Serafina Ln Unit 69
- 11121 Catarina Ln Unit 73
- 10721 Ballystock Ct
- 10713 Ballystock Ct
- 10725 Ballystock Ct
- 10709 Ballystock Ct
- 10729 Ballystock Ct
- 10705 Ballystock Ct
- 10710 Ballystock Ct Unit 4A
- 10733 Ballystock Ct
- 10718 Ballystock Ct
- 11696 Lindley Ct Unit 4
- 10722 Ballystock Ct
- 10704 Ballystock Ct
- 10726 Ballystock Ct
- 10737 Ballystock Ct
- 11684 Lindly Ct
- 10730 Ballystock Ct
- 11697 Lindley Ct
- 11684 Lindley Ct
- 11693 Ramsdell Ct
- 11697 Lindly Ct