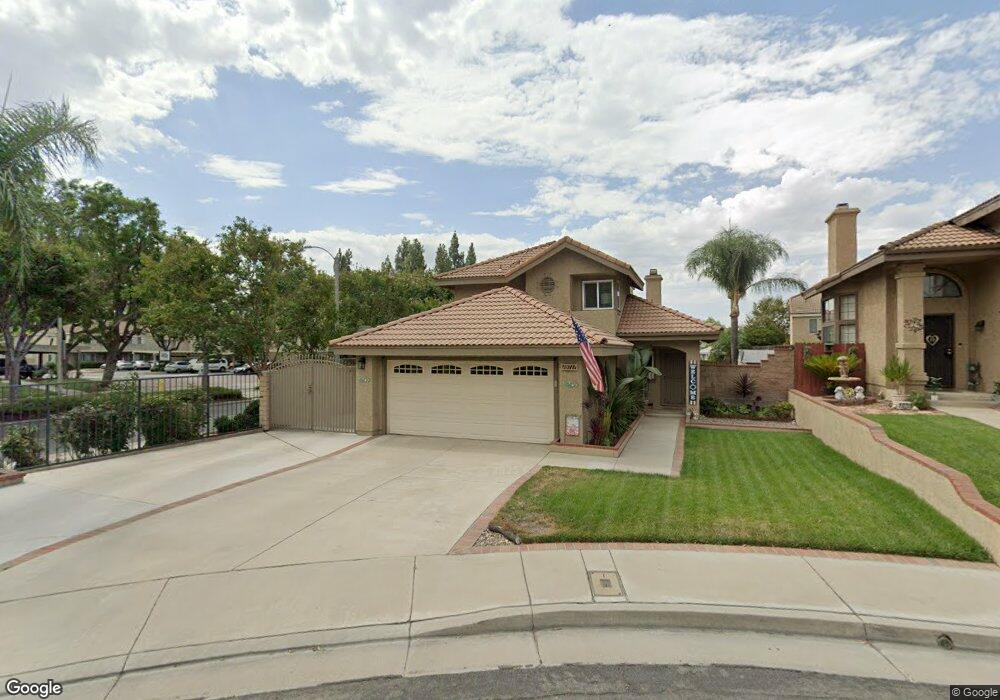
10717 Springfield Dr Rancho Cucamonga, CA 91730
Terra Vista NeighborhoodEstimated Value: $708,161 - $741,000
3
Beds
2
Baths
1,420
Sq Ft
$512/Sq Ft
Est. Value
About This Home
This home is located at 10717 Springfield Dr, Rancho Cucamonga, CA 91730 and is currently estimated at $727,290, approximately $512 per square foot. 10717 Springfield Dr is a home located in San Bernardino County with nearby schools including Ruth Musser Middle, Coyote Canyon Elementary, and Rancho Cucamonga High School.
Ownership History
Date
Name
Owned For
Owner Type
Purchase Details
Closed on
May 20, 2021
Sold by
Mayer Robin J
Bought by
Mayer Jonathan Rollin and Mayer Robin Joy
Current Estimated Value
Purchase Details
Closed on
Apr 5, 2012
Sold by
Mayer Robin J
Bought by
Mayer Robin J
Purchase Details
Closed on
Feb 16, 2011
Sold by
Mayer Jonathan R and Mayer Robin J
Bought by
Mayer Robin J
Purchase Details
Closed on
Apr 23, 2007
Sold by
Mayer Robin and Mora Robin
Bought by
Mayer Jonathan R and Mayer Robin
Home Financials for this Owner
Home Financials are based on the most recent Mortgage that was taken out on this home.
Original Mortgage
$336,500
Outstanding Balance
$203,009
Interest Rate
6.11%
Mortgage Type
New Conventional
Estimated Equity
$524,281
Purchase Details
Closed on
May 8, 2001
Sold by
Martinez Carlos J
Bought by
Mora Robin
Home Financials for this Owner
Home Financials are based on the most recent Mortgage that was taken out on this home.
Original Mortgage
$168,084
Interest Rate
7.15%
Mortgage Type
FHA
Create a Home Valuation Report for This Property
The Home Valuation Report is an in-depth analysis detailing your home's value as well as a comparison with similar homes in the area
Home Values in the Area
Average Home Value in this Area
Purchase History
| Date | Buyer | Sale Price | Title Company |
|---|---|---|---|
| Mayer Jonathan Rollin | -- | None Available | |
| Mayer Robin J | -- | Equity Title Company | |
| Mayer Robin J | -- | Equity Title Company | |
| Mayer Robin J | -- | None Available | |
| Mayer Jonathan R | -- | Old Republic Title | |
| Mora Robin | $207,000 | Landsafe Title |
Source: Public Records
Mortgage History
| Date | Status | Borrower | Loan Amount |
|---|---|---|---|
| Open | Mayer Jonathan R | $336,500 | |
| Previous Owner | Mora Robin | $168,084 |
Source: Public Records
Tax History Compared to Growth
Tax History
| Year | Tax Paid | Tax Assessment Tax Assessment Total Assessment is a certain percentage of the fair market value that is determined by local assessors to be the total taxable value of land and additions on the property. | Land | Improvement |
|---|---|---|---|---|
| 2025 | $3,884 | $305,804 | $73,865 | $231,939 |
| 2024 | $3,884 | $299,808 | $72,417 | $227,391 |
| 2023 | $3,780 | $293,929 | $70,997 | $222,932 |
| 2022 | $3,698 | $288,166 | $69,605 | $218,561 |
| 2021 | $3,696 | $282,515 | $68,240 | $214,275 |
| 2020 | $3,606 | $279,618 | $67,540 | $212,078 |
| 2019 | $3,590 | $274,136 | $66,216 | $207,920 |
| 2018 | $3,504 | $268,761 | $64,918 | $203,843 |
| 2017 | $3,450 | $263,491 | $63,645 | $199,846 |
| 2016 | $3,435 | $258,324 | $62,397 | $195,927 |
| 2015 | $3,394 | $254,444 | $61,460 | $192,984 |
| 2014 | $3,302 | $249,460 | $60,256 | $189,204 |
Source: Public Records
Map
Nearby Homes
- 7688 Gainey Ct
- 7718 Haywood Place
- 7803 Paxton Place
- 10591 Huxley Dr
- 10487 Balsa St
- 10669 Wildrose Dr
- 10627 Wildrose Dr
- 7355 Ambrosia Rd
- 7759 Devonshire Ct
- 10375 Church St Unit 113
- 10375 Church St Unit 74
- 7314 Greenhaven Ave Unit 74
- 11090 Mountain View Dr Unit 53
- 7224 Parkside Place
- 10288 Effen St
- 7522 Calais Ct
- 7175 Summerfield Place
- 7208 Marine Ave
- 10350 Base Line Rd
- 10350 Base Line Rd Unit 192
- 10709 Springfield Dr
- 10703 Springfield Dr
- 10676 Counrtyside
- 10676 Countryside Dr
- 10670 Countryside Dr
- 10699 Springfield Dr
- 10664 Countryside Dr
- 10658 Countryside Dr
- 10693 Springfield Dr
- 10720 Springfield Dr
- 10714 Springfield Dr
- 10708 Springfield Dr
- 10656 Countryside Dr
- 10702 Springfield Dr
- 10685 Springfield Dr
- 7661 Barrington Ct
- 10650 Countryside Dr
- 10696 Springfield Dr
- 7658 Barrington Ct
- 7667 Barrington Ct