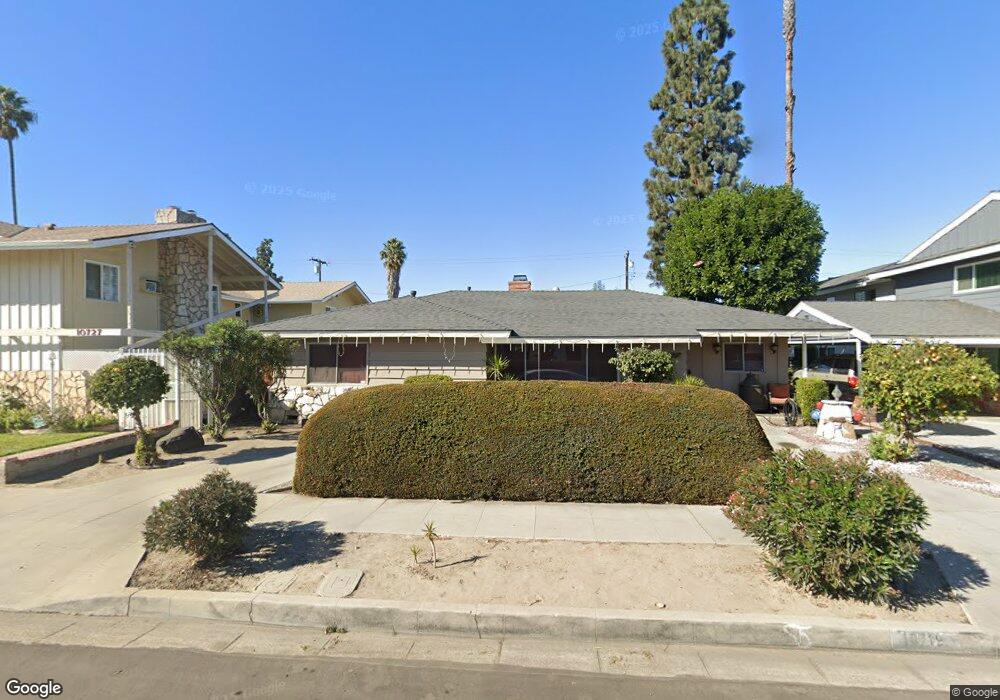
10719 La Reina Ave Downey, CA 90241
Estimated Value: $1,014,000 - $1,162,000
4
Beds
3
Baths
2,580
Sq Ft
$422/Sq Ft
Est. Value
About This Home
This home is located at 10719 La Reina Ave, Downey, CA 90241 and is currently estimated at $1,088,370, approximately $421 per square foot. 10719 La Reina Ave is a home located in Los Angeles County with nearby schools including Rio Hondo Elementary School, Griffiths Middle School, and Warren High School.
Ownership History
Date
Name
Owned For
Owner Type
Purchase Details
Closed on
Nov 20, 2012
Sold by
Avila John L
Bought by
Avila Sophia M
Current Estimated Value
Home Financials for this Owner
Home Financials are based on the most recent Mortgage that was taken out on this home.
Original Mortgage
$416,000
Outstanding Balance
$286,646
Interest Rate
3.33%
Mortgage Type
New Conventional
Estimated Equity
$801,724
Purchase Details
Closed on
Jan 10, 2003
Sold by
Avila John L
Bought by
Avila John L and Avila Sophia
Purchase Details
Closed on
Nov 26, 1997
Sold by
Miller Jacqueline A Saffer and Saffer Jacqueline A
Bought by
Avila John L
Home Financials for this Owner
Home Financials are based on the most recent Mortgage that was taken out on this home.
Original Mortgage
$199,200
Interest Rate
6.9%
Purchase Details
Closed on
Jul 3, 1996
Sold by
Saffer Jacqueline A and The Jessie Evelyn Colman 1987
Bought by
Saffer Jacqueline A and Law Laura Jo
Create a Home Valuation Report for This Property
The Home Valuation Report is an in-depth analysis detailing your home's value as well as a comparison with similar homes in the area
Home Values in the Area
Average Home Value in this Area
Purchase History
| Date | Buyer | Sale Price | Title Company |
|---|---|---|---|
| Avila Sophia M | -- | North American Title Company | |
| Avila John L | -- | -- | |
| Avila John L | $249,000 | Fidelity National Title Ins | |
| Saffer Jacqueline A | -- | -- |
Source: Public Records
Mortgage History
| Date | Status | Borrower | Loan Amount |
|---|---|---|---|
| Open | Avila Sophia M | $416,000 | |
| Previous Owner | Avila John L | $199,200 |
Source: Public Records
Tax History Compared to Growth
Tax History
| Year | Tax Paid | Tax Assessment Tax Assessment Total Assessment is a certain percentage of the fair market value that is determined by local assessors to be the total taxable value of land and additions on the property. | Land | Improvement |
|---|---|---|---|---|
| 2025 | $5,345 | $397,566 | $178,825 | $218,741 |
| 2024 | $5,345 | $389,771 | $175,319 | $214,452 |
| 2023 | $5,174 | $382,130 | $171,882 | $210,248 |
| 2022 | $4,929 | $374,638 | $168,512 | $206,126 |
| 2021 | $4,789 | $367,293 | $165,208 | $202,085 |
| 2020 | $4,719 | $363,527 | $163,514 | $200,013 |
| 2019 | $4,669 | $356,400 | $160,308 | $196,092 |
| 2018 | $4,425 | $349,413 | $157,165 | $192,248 |
| 2016 | $4,270 | $335,847 | $151,063 | $184,784 |
| 2015 | $4,209 | $330,803 | $148,794 | $182,009 |
| 2014 | $3,988 | $324,324 | $145,880 | $178,444 |
Source: Public Records
Map
Nearby Homes
- 10736 La Reina Ave
- 8354 La Villa St
- 10515 Downey Ave
- 10535 Myrtle St
- 8316 Cherokee Dr
- 10440 Manzanar Ave
- 7845 5th St
- 11410 Dolan Ave Unit 112
- 11410 Dolan Ave Unit 237
- 8560 Cherokee Dr
- 11410 Brookshire Ave Unit 424
- 11410 Brookshire Ave Unit 316
- 11410 Brookshire Ave Unit 319
- 8717 6th St
- 8531 10th St
- 0 Florence Ave Unit DW24207080
- 8352 Otto St
- 8509 Cleta St
- 7847 Brookmill Rd
- 9044 Bigby St
- 10727 La Reina Ave
- 10733 La Reina Ave
- 10739 La Reina Ave
- 10720 Western Ave
- 10720 Western Ave Unit 203
- 10720 Western Ave Unit 202
- 10726 Western Ave
- 10701 La Reina Ave
- 10714 Western Ave
- 10714 Western Ave Unit 6
- 8136 6th St
- 10726 La Reina Ave
- 10720 La Reina Ave
- 10730 La Reina Ave Unit A
- 10730 La Reina Ave
- 10730 La Reina Ave
- 8132 6th St
- 8131 5th St
- 10734 Western Ave
- 8116 5th St