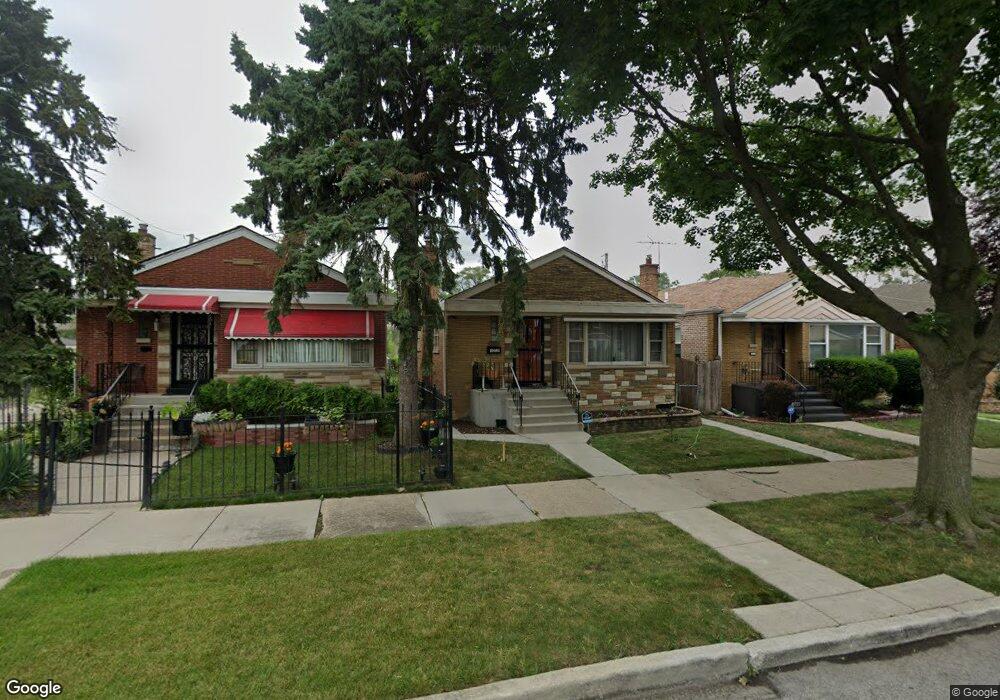
10719 S Rhodes Ave Chicago, IL 60628
Roseland NeighborhoodEstimated Value: $172,000 - $211,000
2
Beds
2
Baths
929
Sq Ft
$207/Sq Ft
Est. Value
About This Home
This home is located at 10719 S Rhodes Ave, Chicago, IL 60628 and is currently estimated at $192,416, approximately $207 per square foot. 10719 S Rhodes Ave is a home located in Cook County with nearby schools including Countee Cullen Elementary School, Corliss High School, and Butler College Prep.
Ownership History
Date
Name
Owned For
Owner Type
Purchase Details
Closed on
Aug 29, 2003
Sold by
Robinson Ollie
Bought by
Washington Yvonne
Current Estimated Value
Home Financials for this Owner
Home Financials are based on the most recent Mortgage that was taken out on this home.
Original Mortgage
$118,838
Interest Rate
6.01%
Mortgage Type
FHA
Purchase Details
Closed on
Aug 17, 2001
Sold by
Johnson Carletta
Bought by
Robinson Ollie
Home Financials for this Owner
Home Financials are based on the most recent Mortgage that was taken out on this home.
Original Mortgage
$95,450
Interest Rate
6.88%
Mortgage Type
FHA
Purchase Details
Closed on
Aug 12, 1993
Sold by
Mann Carlotta Q Johnson and Johnson Carlotta Q
Bought by
Mann Corwin Andre and Mann Carlotta Johnson
Home Financials for this Owner
Home Financials are based on the most recent Mortgage that was taken out on this home.
Original Mortgage
$49,587
Interest Rate
7%
Mortgage Type
FHA
Create a Home Valuation Report for This Property
The Home Valuation Report is an in-depth analysis detailing your home's value as well as a comparison with similar homes in the area
Home Values in the Area
Average Home Value in this Area
Purchase History
| Date | Buyer | Sale Price | Title Company |
|---|---|---|---|
| Washington Yvonne | $120,000 | Pntn | |
| Robinson Ollie | $97,000 | Chicago Title Insurance Co | |
| Mann Corwin Andre | -- | Land Title Company |
Source: Public Records
Mortgage History
| Date | Status | Borrower | Loan Amount |
|---|---|---|---|
| Previous Owner | Washington Yvonne | $118,838 | |
| Previous Owner | Robinson Ollie | $95,450 | |
| Previous Owner | Mann Corwin Andre | $49,587 |
Source: Public Records
Tax History Compared to Growth
Tax History
| Year | Tax Paid | Tax Assessment Tax Assessment Total Assessment is a certain percentage of the fair market value that is determined by local assessors to be the total taxable value of land and additions on the property. | Land | Improvement |
|---|---|---|---|---|
| 2024 | $1,308 | $7,300 | $1,980 | $5,320 |
| 2023 | $1,254 | $9,500 | $4,290 | $5,210 |
| 2022 | $1,254 | $9,500 | $4,290 | $5,210 |
| 2021 | $1,244 | $9,500 | $4,290 | $5,210 |
| 2020 | $1,407 | $9,403 | $2,640 | $6,763 |
| 2019 | $1,414 | $10,448 | $2,640 | $7,808 |
| 2018 | $1,389 | $10,448 | $2,640 | $7,808 |
| 2017 | $1,608 | $10,827 | $2,310 | $8,517 |
| 2016 | $1,672 | $10,827 | $2,310 | $8,517 |
| 2015 | $1,507 | $10,827 | $2,310 | $8,517 |
| 2014 | $1,436 | $10,287 | $1,980 | $8,307 |
| 2013 | $1,396 | $10,287 | $1,980 | $8,307 |
Source: Public Records
Map
Nearby Homes
- 10718 S Rhodes Ave
- 613 E 107th St
- 408 E 107th St
- 10855 S Eberhart Ave
- 10755 S Champlain Ave
- 10734 S Langley Ave
- 10710 S Langley Ave
- 519 E 109th St
- 10611 S Cottage Grove Ave
- 10642 S Langley Ave
- 10614 S Langley Ave
- 10553 S Calumet Ave
- 555 E 105th St
- 10947 S King Dr
- 10721 S Prairie Ave
- 715 E 105th Place
- 10500 S King Dr
- 10734 S Prairie Ave
- 10722 S Prairie Ave
- 10436 S Eberhart Ave
- 10717 S Rhodes Ave
- 10723 S Rhodes Ave
- 10725 S Rhodes Ave
- 10729 S Rhodes Ave
- 543 E 107th St
- 535 E 107th St
- 541 E 107th St Unit 1
- 10733 S Rhodes Ave
- 545 E 107th St
- 10737 S Rhodes Ave
- 10720 S Rhodes Ave
- 10700 S Rhodes Ave
- 10714 S Rhodes Ave
- 10724 S Rhodes Ave
- 10726 S Rhodes Ave
- 521 E 107th St
- 10730 S Rhodes Ave
- 519 E 107th St
- 10741 S Rhodes Ave
- 10732 S Rhodes Ave