Estimated Value: $618,995 - $671,000
--
Bed
1
Bath
2,617
Sq Ft
$249/Sq Ft
Est. Value
About This Home
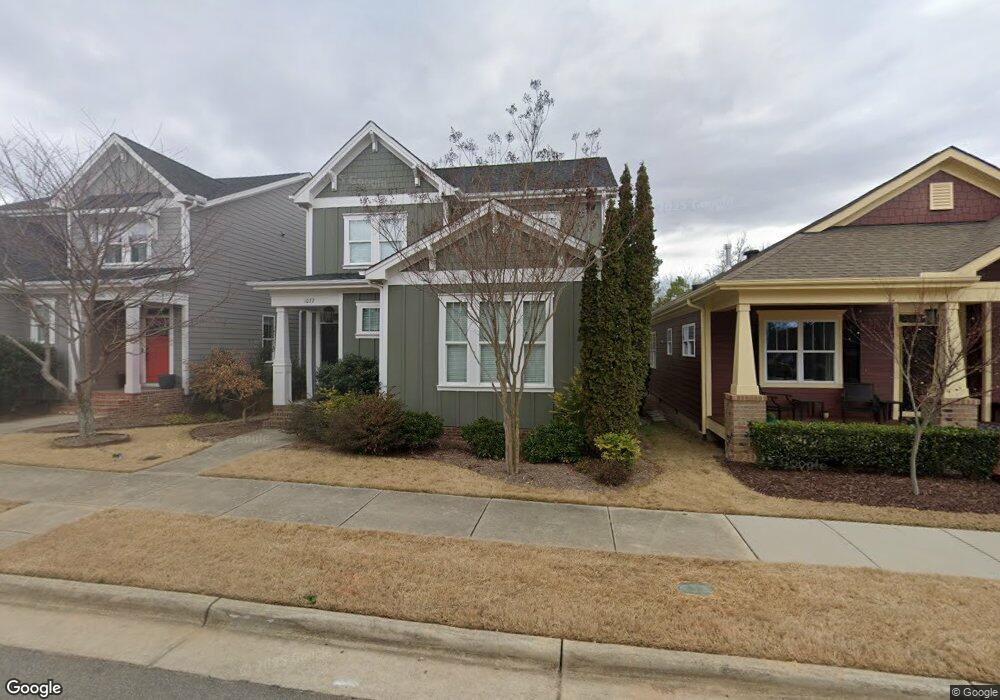
This home is located at 1072 Branch Line Ln, Apex, NC 27502 and is currently estimated at $651,249, approximately $248 per square foot. 1072 Branch Line Ln is a home with nearby schools including Salem Elementary, Salem Middle, and Apex High School.
Ownership History
Date
Name
Owned For
Owner Type
Purchase Details
Closed on
Jun 8, 2020
Sold by
Pardue Jeremy S and Pardue Lauren B
Bought by
Pardue Jeremy S and Pardue Lauren B
Current Estimated Value
Home Financials for this Owner
Home Financials are based on the most recent Mortgage that was taken out on this home.
Original Mortgage
$284,000
Outstanding Balance
$251,744
Interest Rate
3.2%
Mortgage Type
New Conventional
Estimated Equity
$399,505
Purchase Details
Closed on
Apr 17, 2014
Sold by
Stancil Builders Inc
Bought by
Pardue Jeremy S and Pardue Lauren B
Home Financials for this Owner
Home Financials are based on the most recent Mortgage that was taken out on this home.
Original Mortgage
$319,325
Interest Rate
4.33%
Mortgage Type
New Conventional
Purchase Details
Closed on
Oct 14, 2013
Sold by
Apex First Development Llc
Bought by
Stancil Builders Inc
Create a Home Valuation Report for This Property
The Home Valuation Report is an in-depth analysis detailing your home's value as well as a comparison with similar homes in the area
Home Values in the Area
Average Home Value in this Area
Purchase History
| Date | Buyer | Sale Price | Title Company |
|---|---|---|---|
| Pardue Jeremy S | -- | None Available | |
| Pardue Jeremy S | $323,000 | None Available | |
| Stancil Builders Inc | $170,000 | None Available |
Source: Public Records
Mortgage History
| Date | Status | Borrower | Loan Amount |
|---|---|---|---|
| Open | Pardue Jeremy S | $284,000 | |
| Closed | Pardue Jeremy S | $319,325 |
Source: Public Records
Tax History Compared to Growth
Tax History
| Year | Tax Paid | Tax Assessment Tax Assessment Total Assessment is a certain percentage of the fair market value that is determined by local assessors to be the total taxable value of land and additions on the property. | Land | Improvement |
|---|---|---|---|---|
| 2025 | $5,482 | $625,592 | $120,000 | $505,592 |
| 2024 | $5,359 | $625,592 | $120,000 | $505,592 |
| 2023 | $4,668 | $423,665 | $95,000 | $328,665 |
| 2022 | $4,382 | $423,665 | $95,000 | $328,665 |
| 2021 | $4,214 | $423,665 | $95,000 | $328,665 |
| 2020 | $4,172 | $423,665 | $95,000 | $328,665 |
| 2019 | $4,076 | $357,124 | $105,000 | $252,124 |
| 2018 | $3,839 | $357,124 | $105,000 | $252,124 |
| 2017 | $3,573 | $357,124 | $105,000 | $252,124 |
| 2016 | $3,522 | $357,124 | $105,000 | $252,124 |
| 2015 | $3,338 | $330,329 | $90,000 | $240,329 |
| 2014 | $1,068 | $110,300 | $90,000 | $20,300 |
Source: Public Records
Map
Nearby Homes
- 1111 Platform Dr
- 1115 Platform Dr
- 953 Ambergate Station
- 919 Branch Line Ln
- 996 Tender Dr
- 903 Norwood Ln
- 596 Grand Central Station
- 547 Grand Central Station
- 1000 Oakgate Ct
- 1808 N Salem St
- 1003 Lathrop Ln
- 823 Richmont Grove Ln
- 810 Richmont Grove Ln
- 4006 New Yarmouth Way
- 303 Knightsborough Way
- 309 Culvert St
- 311 Culvert St
- 202 W Chatham St
- 506 W Chatham St
- 635 Sawcut Ln
- 1066 Branch Line Ln
- 1080 Branch Line Ln
- 1062 Branch Line Ln
- 1069 Branch Line Ln
- 1086 Branch Line Ln
- 1090 Branch Line Ln
- 1087 Branch Line Ln
- 1087 Branch Line Ln
- 1087 Branch Line Ln Unit 1004A
- 1089 Branch Line Ln Unit 1004B
- 1071 Branch Line Ln Unit 1005C
- 1071 Branch Line Ln
- 1073 Branch Line Ln
- 1073 Branch Line Ln Unit 1005A
- 1091 Branch Line Ln Unit 1004C
- 1067 Branch Line Ln
- 1067 Branch Line Ln Unit 1005D
- 1094 Branch Line Ln
- 1052 Branch Line Ln
- 1098 Branch Line Ln