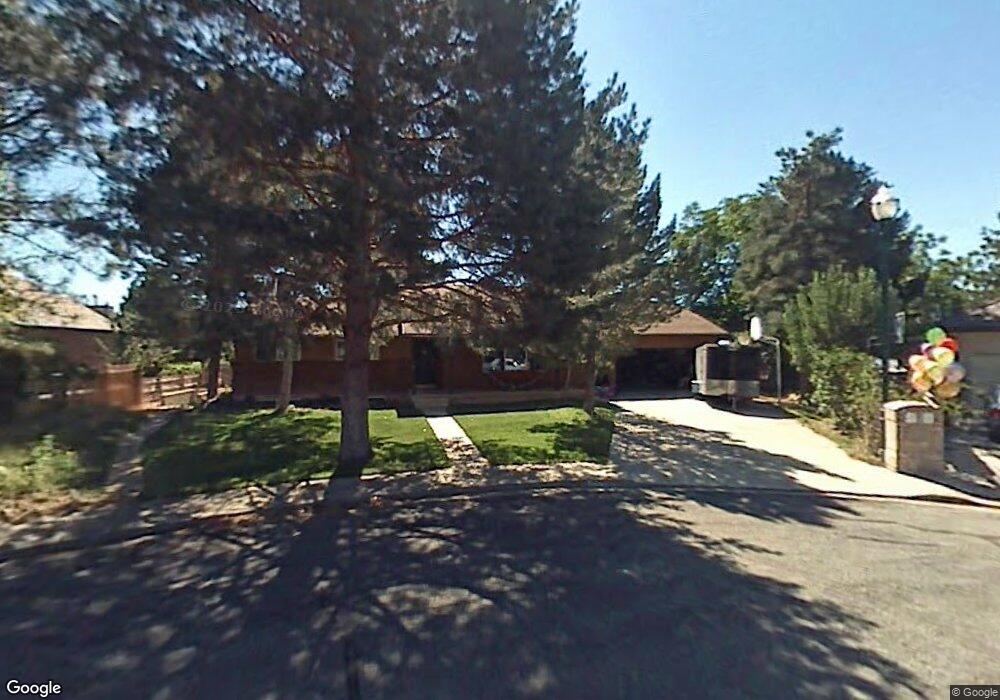
1072 E 920 N Orem, UT 84097
Old Orchard NeighborhoodEstimated Value: $645,000 - $666,000
3
Beds
3
Baths
1,558
Sq Ft
$420/Sq Ft
Est. Value
About This Home
This home is located at 1072 E 920 N, Orem, UT 84097 and is currently estimated at $653,590, approximately $419 per square foot. 1072 E 920 N is a home located in Utah County with nearby schools including Foothill Elementary School, Canyon View Junior High School, and Orem High School.
Ownership History
Date
Name
Owned For
Owner Type
Purchase Details
Closed on
Sep 25, 2019
Sold by
Black Christopher Mckay and Black Ammie Scheetz
Bought by
Black Christopher Mckay
Current Estimated Value
Home Financials for this Owner
Home Financials are based on the most recent Mortgage that was taken out on this home.
Original Mortgage
$308,000
Outstanding Balance
$270,373
Interest Rate
3.6%
Mortgage Type
New Conventional
Estimated Equity
$383,217
Purchase Details
Closed on
Dec 27, 2007
Sold by
Black Christopher M
Bought by
Black Christopher Mckay and Black Ammie Scheetz
Home Financials for this Owner
Home Financials are based on the most recent Mortgage that was taken out on this home.
Original Mortgage
$292,500
Interest Rate
6.15%
Mortgage Type
New Conventional
Purchase Details
Closed on
Dec 9, 2005
Sold by
Black Chris M and Scheettz Ammie M
Bought by
Black Chris M
Home Financials for this Owner
Home Financials are based on the most recent Mortgage that was taken out on this home.
Original Mortgage
$26,500
Interest Rate
6.35%
Mortgage Type
Credit Line Revolving
Purchase Details
Closed on
Feb 18, 2005
Sold by
Black Chris M
Bought by
Black Chris M and Scheettz Ammie M
Home Financials for this Owner
Home Financials are based on the most recent Mortgage that was taken out on this home.
Original Mortgage
$36,000
Interest Rate
5.66%
Mortgage Type
Credit Line Revolving
Purchase Details
Closed on
Sep 23, 2004
Sold by
Fitzwater Kathryn Bennett
Bought by
Black Chris M
Home Financials for this Owner
Home Financials are based on the most recent Mortgage that was taken out on this home.
Original Mortgage
$203,775
Interest Rate
5.8%
Mortgage Type
Purchase Money Mortgage
Purchase Details
Closed on
Feb 27, 1998
Sold by
Fitzwater Patrick Eugene
Bought by
Fitzwater Kathryn Bennett
Home Financials for this Owner
Home Financials are based on the most recent Mortgage that was taken out on this home.
Original Mortgage
$37,500
Interest Rate
7%
Create a Home Valuation Report for This Property
The Home Valuation Report is an in-depth analysis detailing your home's value as well as a comparison with similar homes in the area
Home Values in the Area
Average Home Value in this Area
Purchase History
| Date | Buyer | Sale Price | Title Company |
|---|---|---|---|
| Black Christopher Mckay | -- | Vanguard Title Ins Agcy | |
| Black Christopher Mckay | -- | Inwest Title Services Inc | |
| Black Chris M | -- | Sundance Title Insurance Ag | |
| Black Chris M | -- | Inwest Title Services Inc | |
| Black Chris M | -- | Inwest Title Services Inc | |
| Fitzwater Kathryn Bennett | -- | -- |
Source: Public Records
Mortgage History
| Date | Status | Borrower | Loan Amount |
|---|---|---|---|
| Open | Black Christopher Mckay | $308,000 | |
| Closed | Black Christopher Mckay | $292,500 | |
| Closed | Black Chris M | $26,500 | |
| Closed | Black Chris M | $212,000 | |
| Closed | Black Chris M | $36,000 | |
| Closed | Black Chris M | $192,000 | |
| Closed | Black Chris M | $203,775 | |
| Previous Owner | Fitzwater Kathryn Bennett | $37,500 |
Source: Public Records
Tax History
| Year | Tax Paid | Tax Assessment Tax Assessment Total Assessment is a certain percentage of the fair market value that is determined by local assessors to be the total taxable value of land and additions on the property. | Land | Improvement |
|---|---|---|---|---|
| 2025 | $2,559 | $354,585 | -- | -- |
| 2024 | $2,559 | $312,950 | $0 | $0 |
| 2023 | $2,349 | $308,715 | $0 | $0 |
| 2022 | $2,330 | $296,725 | $0 | $0 |
| 2021 | $2,262 | $436,200 | $234,700 | $201,500 |
| 2020 | $2,089 | $396,000 | $204,100 | $191,900 |
| 2019 | $1,882 | $371,000 | $204,100 | $166,900 |
| 2018 | $1,970 | $371,000 | $204,100 | $166,900 |
| 2017 | $1,806 | $182,215 | $0 | $0 |
| 2016 | $1,797 | $167,145 | $0 | $0 |
| 2015 | $1,782 | $156,750 | $0 | $0 |
| 2014 | $1,686 | $147,675 | $0 | $0 |
Source: Public Records
Map
Nearby Homes
- 551 N 900 E
- 566 N Bella Vista Dr
- 710 E 1280 N
- 976 N 560 E
- 1324 N 750 E Unit 3
- 1356 N 750 E Unit 11
- 733 E 1450 N Unit 5
- 1366 N 750 E
- 747 E 1500 N Unit 13
- 713 E 1450 N Unit 23
- 713 E 1500 St N Unit 19
- 471 E 700 N
- 453 N 650 E
- 723 E 1450 N Unit 25
- 362 E 800 N Unit 1
- 372 E 1165 N
- 181 N 800 E
- 1643 N Mountain Oaks Dr
- 150 N 750 E
- 337 Birchwood Dr
Your Personal Tour Guide
Ask me questions while you tour the home.