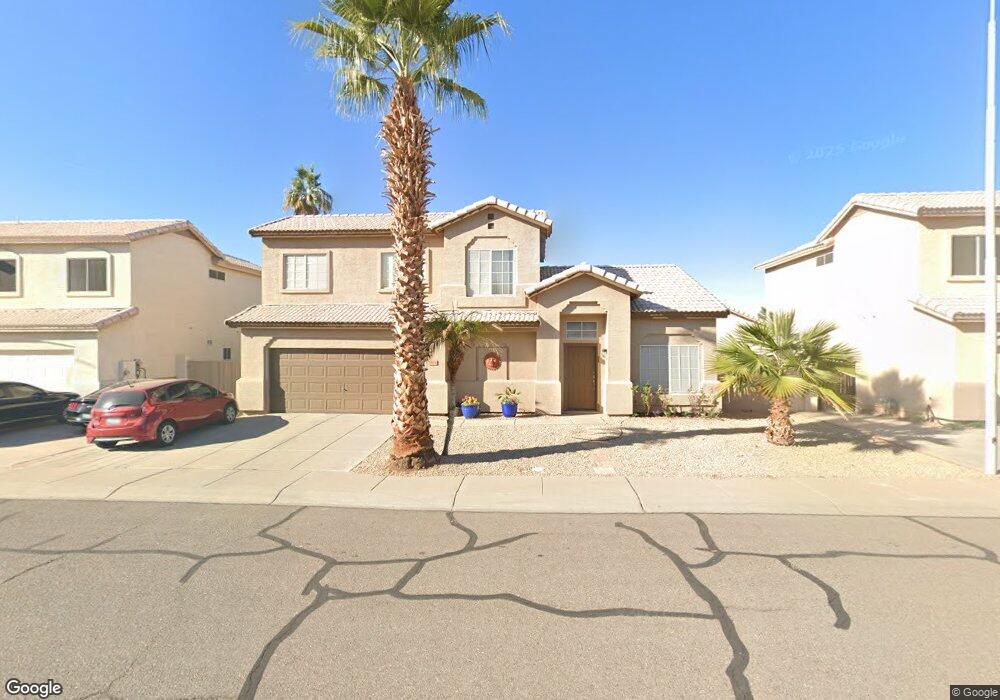
1072 N Velero St Chandler, AZ 85225
The Islands NeighborhoodEstimated Value: $448,498 - $566,000
--
Bed
3
Baths
1,941
Sq Ft
$266/Sq Ft
Est. Value
About This Home
This home is located at 1072 N Velero St, Chandler, AZ 85225 and is currently estimated at $515,375, approximately $265 per square foot. 1072 N Velero St is a home located in Maricopa County with nearby schools including Shumway Elementary School, Willis Junior High School, and Chandler High School.
Ownership History
Date
Name
Owned For
Owner Type
Purchase Details
Closed on
Dec 24, 1998
Sold by
Huffman Anthony R and Whitaker Joseph F
Bought by
Olivas Abran T and Olivas Jill L
Current Estimated Value
Home Financials for this Owner
Home Financials are based on the most recent Mortgage that was taken out on this home.
Original Mortgage
$125,850
Outstanding Balance
$28,463
Interest Rate
6.73%
Mortgage Type
New Conventional
Estimated Equity
$486,912
Purchase Details
Closed on
May 30, 1995
Sold by
Del Webbs Coventry Homes Inc
Bought by
Huffman Anthony R and Whitaker Joseph F
Home Financials for this Owner
Home Financials are based on the most recent Mortgage that was taken out on this home.
Original Mortgage
$110,225
Interest Rate
7.5%
Mortgage Type
FHA
Purchase Details
Closed on
Oct 26, 1994
Sold by
Del Webbs Coventry Homes Construction Co
Bought by
Del Webbs Coventry Homes Inc
Create a Home Valuation Report for This Property
The Home Valuation Report is an in-depth analysis detailing your home's value as well as a comparison with similar homes in the area
Home Values in the Area
Average Home Value in this Area
Purchase History
| Date | Buyer | Sale Price | Title Company |
|---|---|---|---|
| Olivas Abran T | $132,500 | Capital Title Agency | |
| Huffman Anthony R | $111,167 | Transamerica Title Ins Co | |
| Del Webbs Coventry Homes Inc | -- | Transamerica Title Ins Co |
Source: Public Records
Mortgage History
| Date | Status | Borrower | Loan Amount |
|---|---|---|---|
| Open | Olivas Abran T | $125,850 | |
| Previous Owner | Huffman Anthony R | $110,225 |
Source: Public Records
Tax History Compared to Growth
Tax History
| Year | Tax Paid | Tax Assessment Tax Assessment Total Assessment is a certain percentage of the fair market value that is determined by local assessors to be the total taxable value of land and additions on the property. | Land | Improvement |
|---|---|---|---|---|
| 2025 | $1,631 | $20,940 | -- | -- |
| 2024 | $1,575 | $19,943 | -- | -- |
| 2023 | $1,575 | $35,880 | $7,170 | $28,710 |
| 2022 | $1,520 | $27,280 | $5,450 | $21,830 |
| 2021 | $1,593 | $25,450 | $5,090 | $20,360 |
| 2020 | $1,586 | $23,730 | $4,740 | $18,990 |
| 2019 | $1,526 | $21,530 | $4,300 | $17,230 |
| 2018 | $1,477 | $20,220 | $4,040 | $16,180 |
| 2017 | $1,377 | $18,780 | $3,750 | $15,030 |
| 2016 | $1,326 | $18,480 | $3,690 | $14,790 |
| 2015 | $1,285 | $17,950 | $3,590 | $14,360 |
Source: Public Records
Map
Nearby Homes
- 1691 E Gary Dr
- 941 N Adams Ct
- 1126 N Melody Cir
- 1853 E Shannon St
- 1951 E Baylor Ct
- 1590 E Robinson Way
- 791 N Velero St
- 1818 S Saddle St
- 938 W Iris Dr
- 741 N Soho Place
- 1302 N Bedford Dr
- 745 W Ivanhoe St
- 642 N Danyell Ct
- 1214 W Iris Dr
- 1014 E Golden Ct
- 861 W Shellfish Dr
- 916 S Dolphin Dr
- 920 W Grand Caymen Dr
- 643 W Devon Ct
- 955 E Knox Rd Unit 110
- 1082 N Velero St
- 1062 N Velero St
- 1651 E Park Ave
- 1652 E Constitution Dr
- 1691 E Park Ave
- 1641 E Park Ave
- 1682 E Constitution Dr
- 1642 E Constitution Dr
- 1663 E Constitution Dr
- 1701 E Park Ave
- 1660 E Park Ave
- 1670 E Park Ave
- 1673 E Constitution Dr
- 1631 E Park Ave
- 1653 E Constitution Dr
- 1692 E Constitution Dr
- 1650 E Park Ave
- 1680 E Park Ave
- 1632 E Constitution Dr
- 1640 E Park Ave