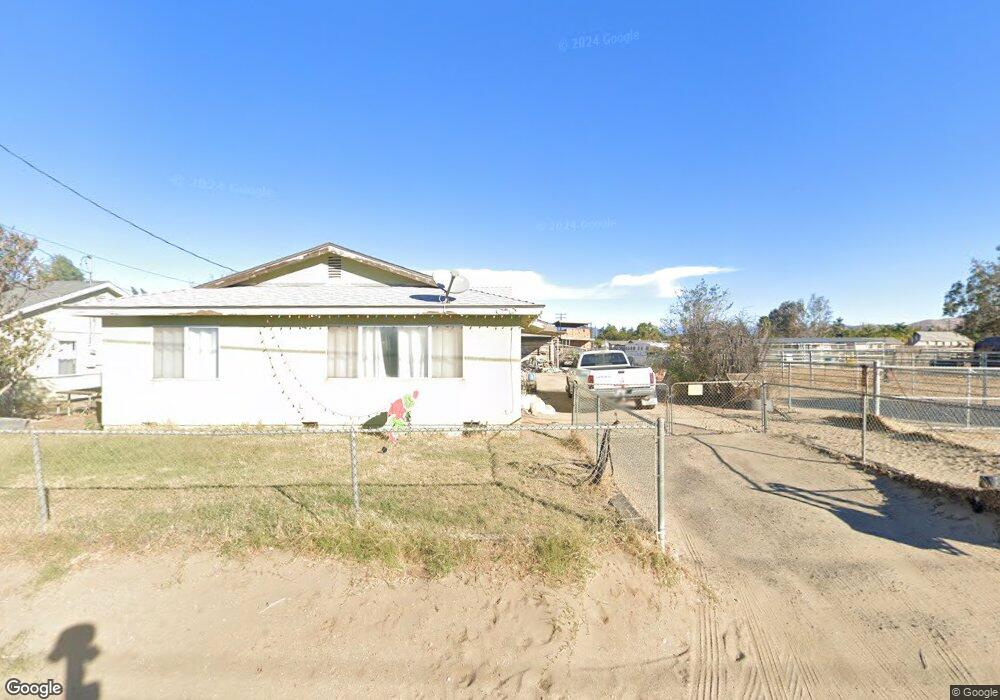
10721 54th St Mira Loma, CA 91752
Estimated Value: $680,450 - $795,000
4
Beds
1
Bath
1,608
Sq Ft
$453/Sq Ft
Est. Value
About This Home
This home is located at 10721 54th St, Mira Loma, CA 91752 and is currently estimated at $728,363, approximately $452 per square foot. 10721 54th St is a home located in Riverside County with nearby schools including Troth Street Elementary School, Mira Loma Middle School, and Jurupa Valley High School.
Ownership History
Date
Name
Owned For
Owner Type
Purchase Details
Closed on
Aug 11, 2010
Sold by
Leach Marshall R and Leach Netta B
Bought by
Leach Marshall R and Leach Netta B
Current Estimated Value
Purchase Details
Closed on
Jul 31, 2003
Sold by
Leach Marshall R and Leach Netta B
Bought by
Leach Marshall R and Leach Netta B
Home Financials for this Owner
Home Financials are based on the most recent Mortgage that was taken out on this home.
Original Mortgage
$140,000
Outstanding Balance
$59,627
Interest Rate
5.17%
Mortgage Type
Purchase Money Mortgage
Estimated Equity
$668,737
Purchase Details
Closed on
Dec 14, 1994
Sold by
Dennison William E and Dennison Mary L
Bought by
Leach Marshall R and Leach Netta B
Purchase Details
Closed on
Nov 9, 1994
Sold by
Leach Marshall R and Leach Netta B
Bought by
Leach Marshall R and Leach Netta B
Create a Home Valuation Report for This Property
The Home Valuation Report is an in-depth analysis detailing your home's value as well as a comparison with similar homes in the area
Home Values in the Area
Average Home Value in this Area
Purchase History
| Date | Buyer | Sale Price | Title Company |
|---|---|---|---|
| Leach Marshall R | -- | None Available | |
| Leach Marshall R | -- | New Century Title Company | |
| Leach Marshall R | $60,000 | Continental Lawyers Title Co | |
| Leach Marshall R | -- | -- |
Source: Public Records
Mortgage History
| Date | Status | Borrower | Loan Amount |
|---|---|---|---|
| Open | Leach Marshall R | $140,000 |
Source: Public Records
Tax History Compared to Growth
Tax History
| Year | Tax Paid | Tax Assessment Tax Assessment Total Assessment is a certain percentage of the fair market value that is determined by local assessors to be the total taxable value of land and additions on the property. | Land | Improvement |
|---|---|---|---|---|
| 2025 | $1,254 | $111,967 | $37,887 | $74,080 |
| 2023 | $1,254 | $107,621 | $36,417 | $71,204 |
| 2022 | $1,235 | $105,511 | $35,703 | $69,808 |
| 2021 | $1,227 | $103,443 | $35,003 | $68,440 |
| 2020 | $1,216 | $102,384 | $34,645 | $67,739 |
| 2019 | $1,193 | $100,377 | $33,966 | $66,411 |
| 2018 | $1,156 | $108,101 | $33,301 | $74,800 |
| 2017 | $1,146 | $106,173 | $32,649 | $73,524 |
| 2016 | $1,131 | $104,282 | $32,009 | $72,273 |
| 2015 | $1,117 | $102,863 | $31,529 | $71,334 |
| 2014 | $1,042 | $101,040 | $30,912 | $70,128 |
Source: Public Records
Map
Nearby Homes
- 10538 54th St
- 11101 Gemini Ct
- 5685 Ptolemy Way
- 10517 50th St
- 10457 50th St
- 4900 Eclipse Ave
- 5286 Trail Canyon Dr
- 11187 58th St
- 6093 Troth St
- 11234 Owen Ct
- 4737 Hot Creek Rd
- 0 Etiwanda Ave & 54th St Unit DW25195682
- 11129 Ryder Rd
- 4775 Wanamaker Dr
- 4795 Bain St
- 5853 Aurora Ave
- 6415 Etiwanda Ave
- 11662 Salvia St
- 9950 60th St
- 9745 55th St
- 10733 54th St
- 10749 54th St
- 10769 54th St
- 10675 54th St
- 5419 Ridgeview Ave
- 5370 Martin St
- 10670 54th St
- 5346 Martin St
- 5388 Martin St
- 5429 Ridgeview Ave
- 10643 54th St
- 10738 54th St
- 5324 Martin St
- 10692 Jurupa Rd
- 5430 Ridgeview Ave
- 10644 54th St
- 5439 Ridgeview Ave Unit A
- 5439 Ridgeview Ave
- 10629 54th St
- 5304 Martin St