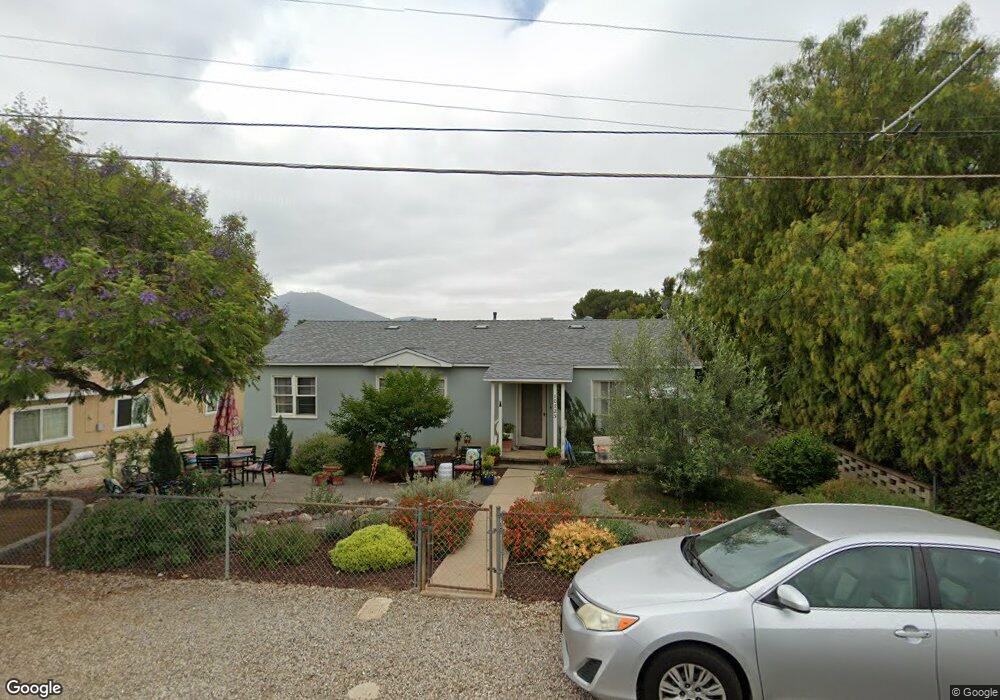
10725 Garden Way Spring Valley, CA 91978
Estimated Value: $711,000 - $786,924
3
Beds
1
Bath
1,446
Sq Ft
$514/Sq Ft
Est. Value
About This Home
This home is located at 10725 Garden Way, Spring Valley, CA 91978 and is currently estimated at $742,731, approximately $513 per square foot. 10725 Garden Way is a home located in San Diego County with nearby schools including Loma Elementary School, Spring Valley Middle School, and Monte Vista High School.
Ownership History
Date
Name
Owned For
Owner Type
Purchase Details
Closed on
Nov 1, 2022
Sold by
Williams Kelly Ann
Bought by
Williams Kelly Ann
Current Estimated Value
Home Financials for this Owner
Home Financials are based on the most recent Mortgage that was taken out on this home.
Original Mortgage
$290,000
Outstanding Balance
$280,588
Interest Rate
6.7%
Mortgage Type
New Conventional
Estimated Equity
$462,143
Purchase Details
Closed on
Sep 15, 2011
Sold by
Williams Linda
Bought by
Shilling Kelly Ann
Home Financials for this Owner
Home Financials are based on the most recent Mortgage that was taken out on this home.
Original Mortgage
$199,920
Interest Rate
4.01%
Mortgage Type
New Conventional
Purchase Details
Closed on
Apr 28, 2011
Sold by
Steuermann Kathy J
Bought by
Williams Linda
Purchase Details
Closed on
May 26, 2010
Sold by
Miller David
Bought by
Steuermann Kathy J
Create a Home Valuation Report for This Property
The Home Valuation Report is an in-depth analysis detailing your home's value as well as a comparison with similar homes in the area
Home Values in the Area
Average Home Value in this Area
Purchase History
| Date | Buyer | Sale Price | Title Company |
|---|---|---|---|
| Williams Kelly Ann | -- | Fidelity National Title | |
| Shilling Kelly Ann | $250,000 | Lawyers Title | |
| Williams Linda | $199,000 | Stewart Title Company | |
| Steuermann Kathy J | -- | None Available |
Source: Public Records
Mortgage History
| Date | Status | Borrower | Loan Amount |
|---|---|---|---|
| Open | Williams Kelly Ann | $290,000 | |
| Previous Owner | Shilling Kelly Ann | $199,920 |
Source: Public Records
Tax History Compared to Growth
Tax History
| Year | Tax Paid | Tax Assessment Tax Assessment Total Assessment is a certain percentage of the fair market value that is determined by local assessors to be the total taxable value of land and additions on the property. | Land | Improvement |
|---|---|---|---|---|
| 2025 | $4,254 | $313,874 | $175,715 | $138,159 |
| 2024 | $4,254 | $307,720 | $172,270 | $135,450 |
| 2023 | $4,118 | $301,688 | $168,893 | $132,795 |
| 2022 | $4,047 | $295,774 | $165,582 | $130,192 |
| 2021 | $4,005 | $289,976 | $162,336 | $127,640 |
| 2020 | $3,840 | $287,004 | $160,672 | $126,332 |
| 2019 | $3,779 | $281,377 | $157,522 | $123,855 |
| 2018 | $3,661 | $275,861 | $154,434 | $121,427 |
| 2017 | $3,571 | $270,453 | $151,406 | $119,047 |
| 2016 | $3,436 | $265,151 | $148,438 | $116,713 |
| 2015 | $3,415 | $261,169 | $146,209 | $114,960 |
| 2014 | $3,355 | $256,054 | $143,345 | $112,709 |
Source: Public Records
Map
Nearby Homes
- 0 Calle Los Arboles Unit AR25121691
- 3536 Ybarra Rd
- 3047 Blue Oak Ct
- 3049 Golden Oak Way
- 3021 Chipwood Ct
- 2916 Alanwood Ct
- 2914 Alanwood Ct
- 2944 Alanwood Ct
- 2976 Anawood Way
- 2914 Elm Tree Ct
- 2960 Elm Tree Ct
- 10351 Don Pico Rd
- 10491 Moorpark St
- 10532 Madrid Way
- 10770 Jamacha Blvd Unit 78
- 3658 Avocado Village Ct Unit 53
- 3649 Avocado Village Ct Unit 154
- 10129 Hercules Way
- 10065 Canyonview Ct
- 10707 Jamacha Blvd Unit 24
- 10719 Garden Way Unit 1
- 10733 Garden Way
- 10728 Garden Way
- 10741 Garden Way
- 10705 Garden Way
- 10720 Garden Way
- 10706 Garden Way
- 3329 Ybarra Rd
- 10736 Garden Way
- 10747 Garden Way
- 10744 Garden Way
- 3411 Ybarra Rd
- 3323 Ybarra Rd
- 10728 Eureka Rd
- 10750 Garden Way
- 3415 Ybarra Rd
- 3313 Ybarra Rd
- 3433 Ybarra Rd
- 3427 Ybarra Rd
- 10736 Eureka Rd