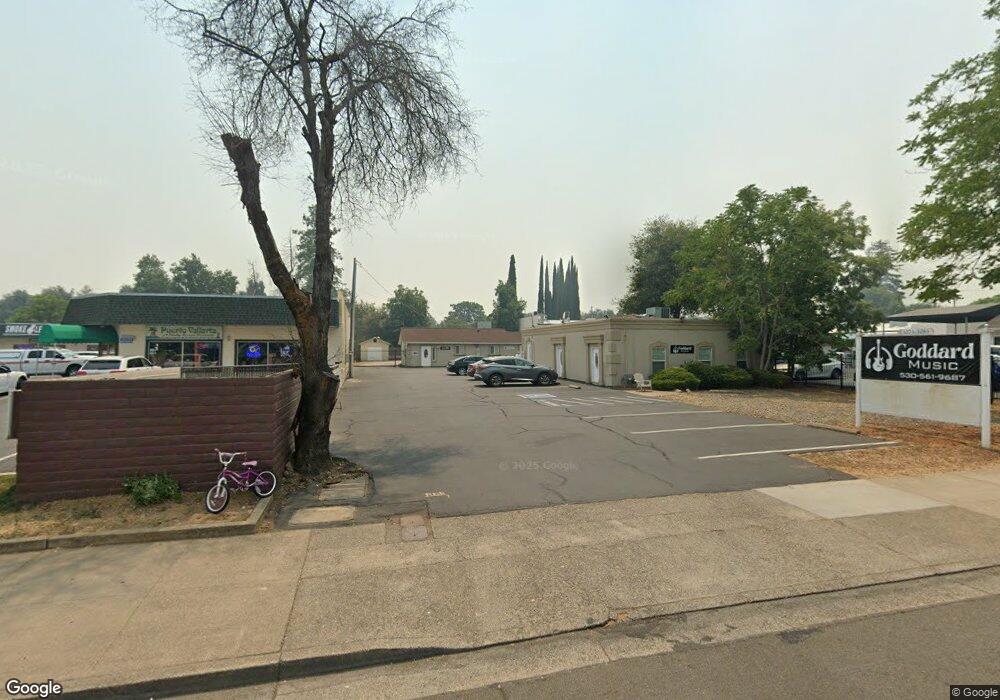
1073-1083 Hartnell Ave Redding, CA 96002
Enterprise Neighborhood
--
Bed
--
Bath
3,200
Sq Ft
0.4
Acres
About This Home
This home is located at 1073-1083 Hartnell Ave, Redding, CA 96002. 1073-1083 Hartnell Ave is a home located in Shasta County with nearby schools including Rother Elementary School, Parsons Junior High School, and Enterprise High School.
Ownership History
Date
Name
Owned For
Owner Type
Purchase Details
Closed on
Jan 14, 2015
Sold by
Preferred Property Investments Llc
Bought by
Hart Property Holdings Llc
Purchase Details
Closed on
Jul 15, 2004
Sold by
Fender Robby R and Fender Kimberley
Bought by
Preferred Property Investments Llc
Purchase Details
Closed on
Feb 20, 2003
Sold by
Grummitt Dennis W and Grummitt Carolyn G
Bought by
Fender Robby R and Fender Kimberley
Home Financials for this Owner
Home Financials are based on the most recent Mortgage that was taken out on this home.
Original Mortgage
$275,000
Interest Rate
5.83%
Mortgage Type
Commercial
Purchase Details
Closed on
Aug 30, 2001
Sold by
Grummitt Dennis W and Grummitt Carolyn G
Bought by
Grummitt Dennis W and Grummitt Carolyn G
Create a Home Valuation Report for This Property
The Home Valuation Report is an in-depth analysis detailing your home's value as well as a comparison with similar homes in the area
Home Values in the Area
Average Home Value in this Area
Purchase History
| Date | Buyer | Sale Price | Title Company |
|---|---|---|---|
| Hart Property Holdings Llc | -- | None Available | |
| Preferred Property Investments Llc | -- | Chicago Title Co | |
| Fender Robby R | $225,000 | Placer Title Company | |
| Grummitt Dennis W | -- | -- |
Source: Public Records
Mortgage History
| Date | Status | Borrower | Loan Amount |
|---|---|---|---|
| Previous Owner | Fender Robby R | $275,000 |
Source: Public Records
Tax History Compared to Growth
Tax History
| Year | Tax Paid | Tax Assessment Tax Assessment Total Assessment is a certain percentage of the fair market value that is determined by local assessors to be the total taxable value of land and additions on the property. | Land | Improvement |
|---|---|---|---|---|
| 2025 | $3,647 | $325,852 | $195,514 | $130,338 |
| 2024 | $3,595 | $319,464 | $191,681 | $127,783 |
| 2023 | $3,595 | $313,201 | $187,923 | $125,278 |
| 2022 | $3,495 | $307,061 | $184,239 | $122,822 |
| 2021 | $3,377 | $301,041 | $180,627 | $120,414 |
| 2020 | $3,361 | $297,955 | $178,775 | $119,180 |
| 2019 | $3,334 | $292,114 | $175,270 | $116,844 |
| 2018 | $3,170 | $275,000 | $125,000 | $150,000 |
| 2017 | $2,998 | $250,000 | $120,000 | $130,000 |
| 2016 | $2,425 | $210,000 | $110,000 | $100,000 |
| 2015 | $2,441 | $210,000 | $110,000 | $100,000 |
| 2014 | $2,023 | $170,000 | $80,000 | $90,000 |
Source: Public Records
Map
Nearby Homes
- 2915 Rockabye Ln
- 2953 Churn Ct
- 0 Churn Creek Rd Unit 25-496
- 2919 Blueview St
- 2901 Blue View St
- 3178 Lawrence Rd
- 1091 Del Sol Place
- 2820 Alfreda Way
- 2786 Larkspur Ln
- 1221 E Cypress Ave Unit 67
- 3428 Adams Ln
- 952 Camino Ct
- 953 Camino Ct
- 1118 4th St
- 3527 Adams Ln
- 3283 Middleton Ln
- 3293 Middleton Ln
- 855 Jefferson Ct
- 3591 Adams Ln
- 3710 Indio Way
- 1073 Hartnell Ave
- 1083 Hartnell Ave
- 1045 Hartnell Ave
- 1109 Hartnell Ave
- 1056 Bond St
- 1084 Bond St
- 1100 Hartnell Ave
- 3023 Churn Creek Rd
- 1074/78 Bond St
- 1074 Bond St
- 1094 Bond St
- 1112 Bond St
- 1145 Hartnell Ave
- 1133 Hartnell Ave
- 1131 Hartnell Ave
- 1129 Hartnell Ave
- 1020 Bond St
- 3061 Churn Creek Rd
- 1120 Bond St
- 1137 Hartnell Ave