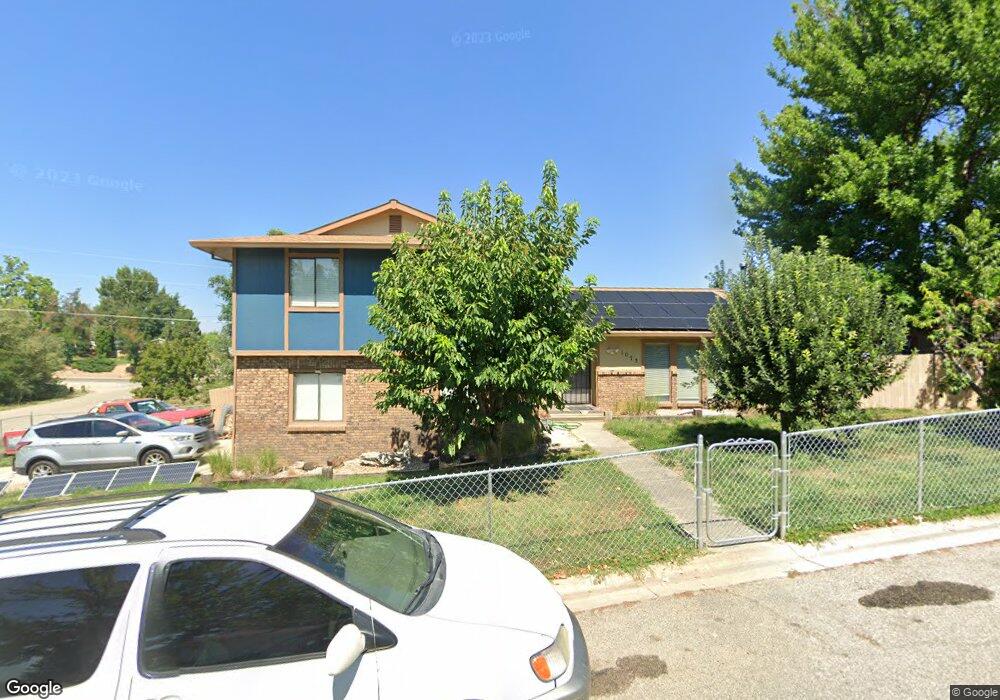
1073 Lilac Ln Unit 2323 Emmett, ID 83617
Gem County NeighborhoodEstimated Value: $422,000 - $532,000
4
Beds
4
Baths
2,094
Sq Ft
$226/Sq Ft
Est. Value
About This Home
This home is located at 1073 Lilac Ln Unit 2323, Emmett, ID 83617 and is currently estimated at $473,874, approximately $226 per square foot. 1073 Lilac Ln Unit 2323 is a home located in Gem County with nearby schools including Shadow Butte Elementary School and Calvary Christian Academy.
Ownership History
Date
Name
Owned For
Owner Type
Purchase Details
Closed on
May 30, 2019
Sold by
Biggers Jenny L and Biggers Michael
Bought by
Haylo Atchinson Donald Joseph and Haylo Atchinson Rebecca
Current Estimated Value
Home Financials for this Owner
Home Financials are based on the most recent Mortgage that was taken out on this home.
Original Mortgage
$225,710
Outstanding Balance
$198,454
Interest Rate
4.1%
Mortgage Type
VA
Estimated Equity
$275,420
Purchase Details
Closed on
Oct 21, 2008
Sold by
Biggers Mike J
Bought by
Biggers Jenny L
Purchase Details
Closed on
Sep 16, 2005
Sold by
Butler John W and Butler Leona J
Bought by
Leuven Jeffrey K Van and Leuven Jacquelynn R Van
Home Financials for this Owner
Home Financials are based on the most recent Mortgage that was taken out on this home.
Original Mortgage
$38,007
Interest Rate
5.81%
Mortgage Type
Stand Alone Second
Create a Home Valuation Report for This Property
The Home Valuation Report is an in-depth analysis detailing your home's value as well as a comparison with similar homes in the area
Home Values in the Area
Average Home Value in this Area
Purchase History
| Date | Buyer | Sale Price | Title Company |
|---|---|---|---|
| Haylo Atchinson Donald Joseph | -- | Alliance Title Boise Product | |
| Biggers Jenny L | $312,000 | -- | |
| Biggers Jenny L | -- | -- | |
| Leuven Jeffrey K Van | -- | -- |
Source: Public Records
Mortgage History
| Date | Status | Borrower | Loan Amount |
|---|---|---|---|
| Open | Haylo Atchinson Donald Joseph | $225,710 | |
| Previous Owner | Leuven Jeffrey K Van | $38,007 |
Source: Public Records
Tax History Compared to Growth
Tax History
| Year | Tax Paid | Tax Assessment Tax Assessment Total Assessment is a certain percentage of the fair market value that is determined by local assessors to be the total taxable value of land and additions on the property. | Land | Improvement |
|---|---|---|---|---|
| 2024 | $841 | $392,222 | $85,481 | $306,741 |
| 2023 | $797 | $434,735 | $100,316 | $334,419 |
| 2021 | $1,087 | $342,122 | $56,107 | $286,015 |
| 2020 | $1,047 | $255,910 | $43,203 | $212,707 |
| 2019 | $1,112 | $259,096 | $43,203 | $215,893 |
| 2018 | $1,030 | $227,448 | $31,203 | $196,245 |
| 2017 | $996 | $199,350 | $29,480 | $169,870 |
| 2016 | $1,009 | $188,970 | $28,910 | $160,060 |
| 2015 | $1,047 | $186,410 | $27,480 | $158,930 |
| 2014 | $1,047 | $169,340 | $24,620 | $144,720 |
Source: Public Records
Map
Nearby Homes
- tbd van Deusen
- TBD Countryside Ln
- 9857 Eleanor Ln
- 1440 Castle Way
- Lot 8 Jake Ln
- TBD Fulller Rd
- Lot 1 Block 1 White Owl Ranch
- 7XXX Ruth Ln
- TBD #4 Ruth Ln
- XXXX Lot 6 Ruth Ln
- 1679 Greenfields Loop
- 1015 Greenfields Ln
- 1021 W Idaho Blvd
- Lot 11 Corbett Rd
- Lot 17 Blake Rd
- 2495 Bovi Ln
- 687 W Idaho Blvd
- 4801 Harmony Ln
- 1605 Ruby Ln
- 1609 Ruby Ln