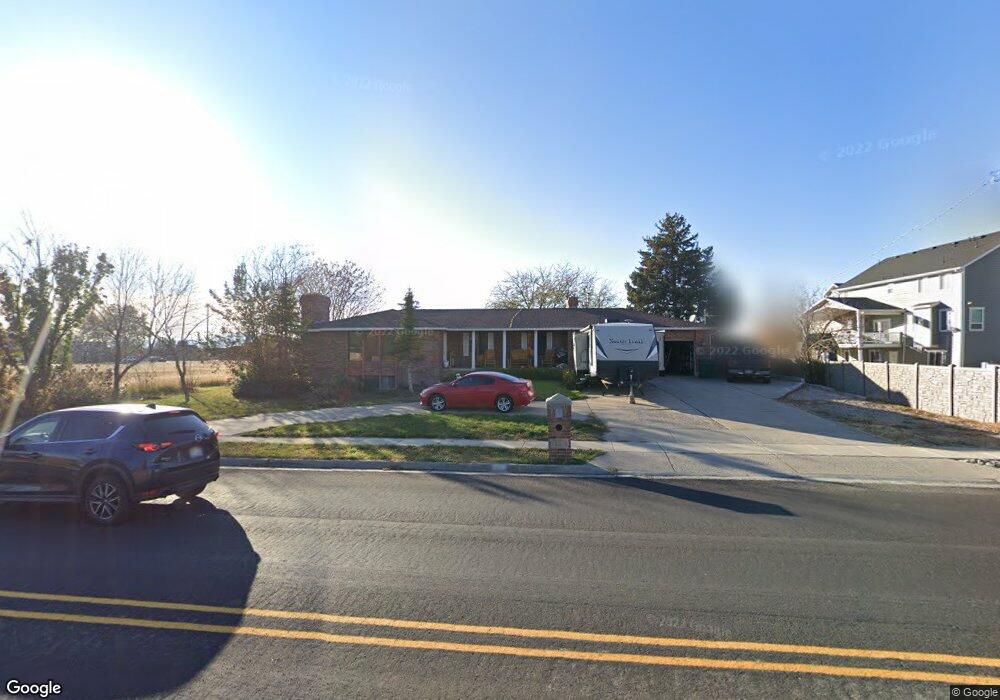
1073 N 2200 W Layton, UT 84041
Estimated Value: $570,000 - $777,919
4
Beds
4
Baths
3,975
Sq Ft
$172/Sq Ft
Est. Value
About This Home
This home is located at 1073 N 2200 W, Layton, UT 84041 and is currently estimated at $682,980, approximately $171 per square foot. 1073 N 2200 W is a home located in Davis County with nearby schools including Ellison Park School, Shoreline Junior High School, and Layton High School.
Ownership History
Date
Name
Owned For
Owner Type
Purchase Details
Closed on
Dec 19, 2007
Sold by
Hardison Cindy
Bought by
Denno David J
Current Estimated Value
Purchase Details
Closed on
May 24, 2004
Sold by
Hardison Phillip M and Hardison Cindy
Bought by
Hardison Cindy and Hardison Phillip M
Home Financials for this Owner
Home Financials are based on the most recent Mortgage that was taken out on this home.
Original Mortgage
$180,000
Interest Rate
5.86%
Mortgage Type
Credit Line Revolving
Purchase Details
Closed on
Nov 20, 1996
Sold by
Hardison Phillip M and Hardison Cindy
Bought by
Hardison Cindy and Hardison Phillip M
Create a Home Valuation Report for This Property
The Home Valuation Report is an in-depth analysis detailing your home's value as well as a comparison with similar homes in the area
Home Values in the Area
Average Home Value in this Area
Purchase History
| Date | Buyer | Sale Price | Title Company |
|---|---|---|---|
| Denno David J | -- | Highland Title | |
| Hardison Cindy | -- | None Available | |
| Hardison Cindy | -- | None Available | |
| Hardison Cindy | -- | Security Title Company | |
| Hardison Phillip M | -- | Security Title Company | |
| Hardison Cindy | -- | -- |
Source: Public Records
Mortgage History
| Date | Status | Borrower | Loan Amount |
|---|---|---|---|
| Previous Owner | Hardison Phillip M | $180,000 |
Source: Public Records
Tax History Compared to Growth
Tax History
| Year | Tax Paid | Tax Assessment Tax Assessment Total Assessment is a certain percentage of the fair market value that is determined by local assessors to be the total taxable value of land and additions on the property. | Land | Improvement |
|---|---|---|---|---|
| 2025 | $3,778 | $396,550 | $163,060 | $233,490 |
| 2024 | $3,724 | $393,799 | $167,791 | $226,008 |
| 2023 | $3,605 | $672,000 | $192,182 | $479,818 |
| 2022 | $3,956 | $400,400 | $102,644 | $297,756 |
| 2021 | $3,438 | $519,000 | $153,875 | $365,125 |
| 2020 | $3,170 | $459,000 | $133,967 | $325,033 |
| 2019 | $2,940 | $417,000 | $126,372 | $290,628 |
| 2018 | $2,676 | $381,000 | $112,026 | $268,974 |
| 2016 | $2,563 | $188,290 | $49,818 | $138,472 |
| 2015 | $2,474 | $172,505 | $49,818 | $122,687 |
| 2014 | $2,316 | $165,148 | $49,818 | $115,330 |
| 2013 | -- | $136,291 | $33,874 | $102,417 |
Source: Public Records
Map
Nearby Homes
- 2115 W 1225 N
- 1071 Jamie-Matt Cir
- 1452 N 1875 W Unit 146
- 1430 N 2100 W
- 1451 N 1875 W Unit 168
- 1455 N 1875 W Unit 167
- 1459 N 1875 W
- 1459 N 1875 W Unit 166
- 1463 N 1875 W Unit 165
- 1463 N 1875 W
- 2153 W 775 N
- 1479 N 1875 W
- 1479 N 1875 W Unit 161
- 1483 N 1875 W
- 1487 N 1875 W
- 1487 N 1875 W Unit 159
- 1491 N 1875 W
- 1491 N 1875 W Unit 158
- 979 Cold Creek Way
- 1476 N 1875 W Unit 164