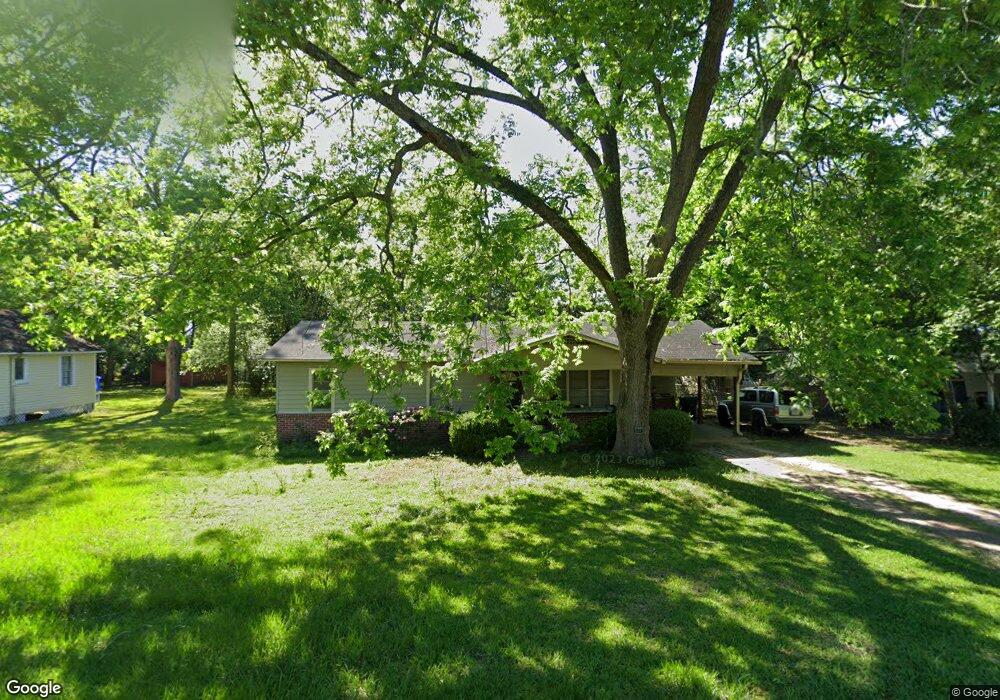
1073 N Peachtree St Coolidge, GA 31738
Estimated Value: $112,449 - $153,000
--
Bed
1
Bath
1,092
Sq Ft
$117/Sq Ft
Est. Value
About This Home
This home is located at 1073 N Peachtree St, Coolidge, GA 31738 and is currently estimated at $127,612, approximately $116 per square foot. 1073 N Peachtree St is a home located in Thomas County with nearby schools including Hand in Hand Primary School, Cross Creek Elementary School, and Garrison-Pilcher Elementary School.
Ownership History
Date
Name
Owned For
Owner Type
Purchase Details
Closed on
Aug 1, 2012
Sold by
Pilkinton Brady E
Bought by
Harper John Franklin
Current Estimated Value
Purchase Details
Closed on
Jul 16, 2009
Sold by
Eaton Glenn L
Bought by
Pilkinton Brady E and Pilkinton Cassandra L
Home Financials for this Owner
Home Financials are based on the most recent Mortgage that was taken out on this home.
Original Mortgage
$53,550
Interest Rate
5.27%
Mortgage Type
New Conventional
Purchase Details
Closed on
Mar 29, 2006
Sold by
Prevatt Toni M
Bought by
Eaton Glenn L and Eaton Debra K
Purchase Details
Closed on
Jun 11, 2003
Sold by
Hutchison Odessa
Bought by
Prevatt Toni M
Purchase Details
Closed on
May 15, 1995
Bought by
Hutchison Odessa
Create a Home Valuation Report for This Property
The Home Valuation Report is an in-depth analysis detailing your home's value as well as a comparison with similar homes in the area
Home Values in the Area
Average Home Value in this Area
Purchase History
| Date | Buyer | Sale Price | Title Company |
|---|---|---|---|
| Harper John Franklin | $50,500 | -- | |
| Pilkinton Brady E | $59,500 | -- | |
| Eaton Glenn L | $58,000 | -- | |
| Prevatt Toni M | $18,000 | -- | |
| Hutchison Odessa | $24,000 | -- |
Source: Public Records
Mortgage History
| Date | Status | Borrower | Loan Amount |
|---|---|---|---|
| Previous Owner | Pilkinton Brady E | $53,550 | |
| Closed | Harper John Franklin | $0 |
Source: Public Records
Tax History Compared to Growth
Tax History
| Year | Tax Paid | Tax Assessment Tax Assessment Total Assessment is a certain percentage of the fair market value that is determined by local assessors to be the total taxable value of land and additions on the property. | Land | Improvement |
|---|---|---|---|---|
| 2024 | $914 | $27,655 | $775 | $26,880 |
| 2023 | $854 | $26,179 | $775 | $25,404 |
| 2022 | $554 | $23,084 | $620 | $22,464 |
| 2021 | $518 | $19,627 | $620 | $19,007 |
| 2020 | $524 | $19,408 | $620 | $18,788 |
| 2019 | $527 | $19,408 | $620 | $18,788 |
| 2018 | $528 | $19,276 | $620 | $18,656 |
| 2017 | $539 | $19,406 | $552 | $18,854 |
| 2016 | $524 | $18,789 | $552 | $18,237 |
| 2015 | $576 | $20,473 | $515 | $19,958 |
| 2014 | $566 | $19,986 | $515 | $19,471 |
| 2013 | -- | $19,986 | $514 | $19,471 |
Source: Public Records
Map
Nearby Homes
- 0000 N
- 4016 E Japonica Ave
- 100 Morgan Place
- 102 Morgan Place
- 258
- 5081-CG S Pine St
- 2069 Baker Rd
- 21688 U S 319
- 21688 US Highway 319 N
- 3007 Zion Grove Church Rd
- 1291 Myron Hart Rd
- 963 Vinson Rd
- xx Ga Hwy 319 N
- 1557 US Highway 319 S
- 10806 Georgia 202
- 16343 Ga Hwy 33 - 8 34 Acres Hwy
- 16343 Georgia 33
- 16343 Ga Hwy 33 -8 34 Acres
- 16343
- 3812 Ponder Rd
- 1285 N Peachtree St
- 1051 N Peachtree St
- 2044 E Oleander Ave
- 2071 E Japonica Ave
- 2026 E Oleander Ave
- 2041 N Peachtree St
- 2061 E Oleander Ave
- 2045 E Japonica Ave
- 2022 E Oleander Ave
- 1062 N Walnut St
- 2031 E Oleander Ave
- 2022 N Peachtree St
- 1092 N Walnut St
- 2003 E Oleander Ave
- 3014 E Japonica Ave
- 3047 E Japonica Ave
- 2060 N Peachtree St
- 3077 E Oleander Ave
- 2077 N Peachtree St
- 2016 E Japonica Ave