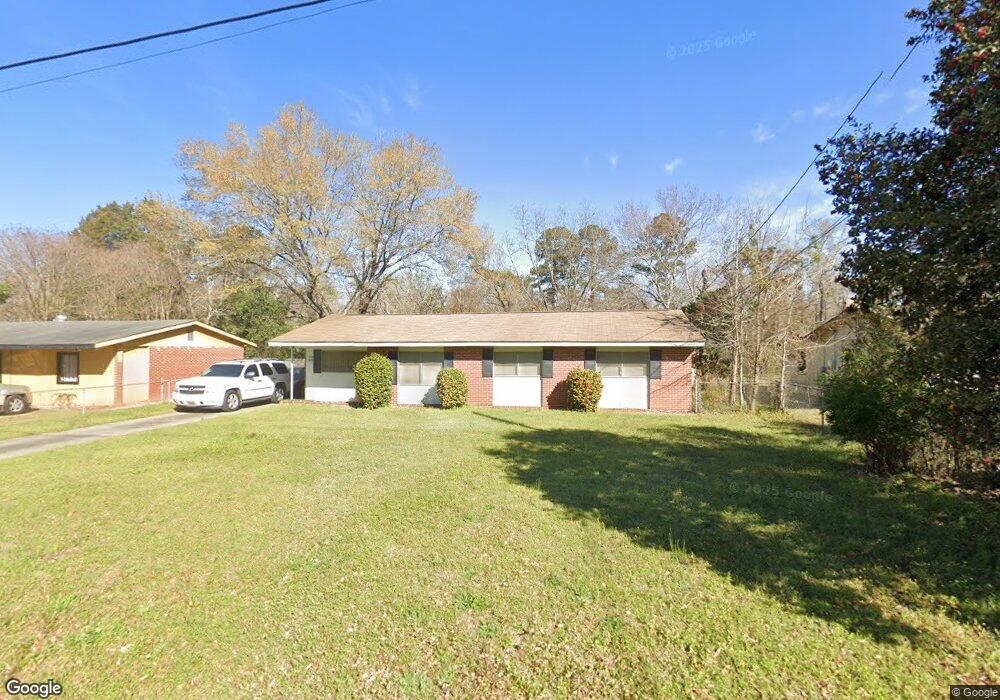
1073 Quincy Dr Columbus, GA 31906
Eastern Columbus NeighborhoodEstimated Value: $87,000 - $104,000
3
Beds
2
Baths
1,283
Sq Ft
$75/Sq Ft
Est. Value
About This Home
This home is located at 1073 Quincy Dr, Columbus, GA 31906 and is currently estimated at $95,750, approximately $74 per square foot. 1073 Quincy Dr is a home located in Muscogee County with nearby schools including Lonnie Jackson Academy, Rothschild Leadership Academy, and Carver High School.
Ownership History
Date
Name
Owned For
Owner Type
Purchase Details
Closed on
Dec 10, 2007
Sold by
Champion Levester and Champion Florence B
Bought by
Mahone Brandon T
Current Estimated Value
Home Financials for this Owner
Home Financials are based on the most recent Mortgage that was taken out on this home.
Original Mortgage
$5,000
Outstanding Balance
$3,152
Interest Rate
6.22%
Mortgage Type
Unknown
Estimated Equity
$92,598
Create a Home Valuation Report for This Property
The Home Valuation Report is an in-depth analysis detailing your home's value as well as a comparison with similar homes in the area
Home Values in the Area
Average Home Value in this Area
Purchase History
| Date | Buyer | Sale Price | Title Company |
|---|---|---|---|
| Mahone Brandon T | $77,000 | None Available |
Source: Public Records
Mortgage History
| Date | Status | Borrower | Loan Amount |
|---|---|---|---|
| Open | Mahone Brandon T | $5,000 | |
| Open | Mahone Brandon T | $74,095 |
Source: Public Records
Tax History Compared to Growth
Tax History
| Year | Tax Paid | Tax Assessment Tax Assessment Total Assessment is a certain percentage of the fair market value that is determined by local assessors to be the total taxable value of land and additions on the property. | Land | Improvement |
|---|---|---|---|---|
| 2025 | $735 | $31,400 | $5,004 | $26,396 |
| 2024 | $733 | $31,400 | $5,004 | $26,396 |
| 2023 | $44 | $31,400 | $5,004 | $26,396 |
| 2022 | $765 | $25,512 | $5,004 | $20,508 |
| 2021 | $758 | $25,480 | $5,004 | $20,476 |
| 2020 | $758 | $25,480 | $5,004 | $20,476 |
| 2019 | $762 | $25,480 | $5,004 | $20,476 |
| 2018 | $762 | $25,480 | $5,004 | $20,476 |
| 2017 | $766 | $25,480 | $5,004 | $20,476 |
| 2016 | $770 | $31,949 | $2,700 | $29,249 |
| 2015 | $772 | $31,949 | $2,700 | $29,249 |
| 2014 | $773 | $31,949 | $2,700 | $29,249 |
| 2013 | -- | $31,949 | $2,700 | $29,249 |
Source: Public Records
Map
Nearby Homes
- 939 Pembrook Dr
- 1235 Woodburn Ct
- 3570 Stratford Dr
- 3914 N Linden Dr
- 1122 Woodburn Ct
- 827 Brighton Rd
- 920 Ashland Ave
- 3934 Linden Cir
- 3938 Linden Cir
- 800 Morris Rd
- 3415 Terminal St
- 776 Terminal Ct
- 3319 Decatur St
- 3414 Terminal St
- 679 Parkchester Dr
- 3413 Terminal Ct
- 1061 Dunbar Ave
- 833 33rd Ave
- 1104 Dunbar Ave
- 3562 Woodland Dr
- 1103 Quincy Dr
- 1067 Quincy Dr
- 1061 Quincy Dr
- 1109 Quincy Dr
- 1068 Quincy Dr
- 1052 Farwell Dr
- 1055 Quincy Dr
- 1064 Quincy Dr
- 1047 Farwell Dr
- 1046 Farwell Dr
- 1049 Quincy Dr
- 1056 Quincy Dr
- 1111 Quincy Dr
- 1045 Brighton Rd
- 1040 Farwell Dr
- 1037 Brighton Rd
- 1048 Quincy Dr
- 1029 Brighton Rd
- 1032 Farwell Dr
- 1042 Quincy Dr