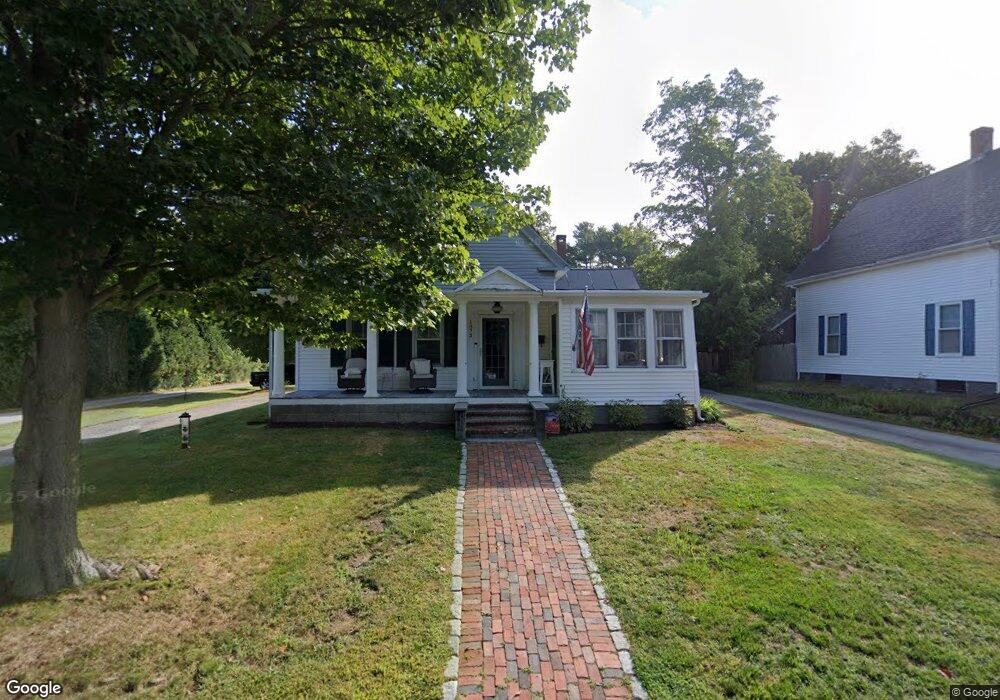
1073 Union St Rockland, MA 02370
Estimated Value: $502,000 - $602,000
--
Bed
2
Baths
2,172
Sq Ft
$255/Sq Ft
Est. Value
About This Home
This home is located at 1073 Union St, Rockland, MA 02370 and is currently estimated at $553,308, approximately $254 per square foot. 1073 Union St is a home located in Plymouth County with nearby schools including Rockland Senior High School, Calvary Chapel Academy, and St Bridget School.
Ownership History
Date
Name
Owned For
Owner Type
Purchase Details
Closed on
May 2, 2017
Sold by
Hannigan Morgan T
Bought by
Hannigan Morgan T and Hannigan Kaitlin M
Current Estimated Value
Purchase Details
Closed on
Jan 13, 2016
Sold by
Shortall Betty F Est
Bought by
Hannigan Morgan T
Home Financials for this Owner
Home Financials are based on the most recent Mortgage that was taken out on this home.
Original Mortgage
$196,185
Interest Rate
4.4%
Mortgage Type
FHA
Create a Home Valuation Report for This Property
The Home Valuation Report is an in-depth analysis detailing your home's value as well as a comparison with similar homes in the area
Home Values in the Area
Average Home Value in this Area
Purchase History
| Date | Buyer | Sale Price | Title Company |
|---|---|---|---|
| Hannigan Morgan T | -- | -- | |
| Hannigan Morgan T | $165,000 | -- |
Source: Public Records
Mortgage History
| Date | Status | Borrower | Loan Amount |
|---|---|---|---|
| Previous Owner | Hannigan Morgan T | $196,185 |
Source: Public Records
Tax History Compared to Growth
Tax History
| Year | Tax Paid | Tax Assessment Tax Assessment Total Assessment is a certain percentage of the fair market value that is determined by local assessors to be the total taxable value of land and additions on the property. | Land | Improvement |
|---|---|---|---|---|
| 2025 | $7,472 | $546,600 | $222,500 | $324,100 |
| 2024 | $7,254 | $515,900 | $209,900 | $306,000 |
| 2023 | $7,365 | $483,900 | $202,700 | $281,200 |
| 2022 | $7,045 | $420,600 | $176,300 | $244,300 |
| 2021 | $6,466 | $374,200 | $160,200 | $214,000 |
| 2020 | $6,242 | $356,700 | $152,600 | $204,100 |
| 2019 | $6,109 | $340,200 | $145,400 | $194,800 |
| 2018 | $6,269 | $318,200 | $145,400 | $172,800 |
| 2017 | $5,599 | $303,000 | $145,400 | $157,600 |
| 2016 | $5,231 | $282,900 | $139,800 | $143,100 |
| 2015 | $5,180 | $272,200 | $130,700 | $141,500 |
| 2014 | $4,897 | $267,000 | $128,100 | $138,900 |
Source: Public Records
Map
Nearby Homes
- 35-37 Salem St
- 775 Union St
- 737-739 Union St
- 94 Leisurewoods Dr
- 86 Leisurewoods Dr Unit 279
- 5 Juniper Cir
- 3 Hickory Cir
- 83 Summit St
- 45 Leisurewoods Dr
- 12 Dyer St Unit 12
- 14 Dyer St Unit 14
- 27 Fir Rd
- 18 Midfield Dr
- 11 Dyer St Unit 11
- 13 Dyer St Unit 13
- 17-23 Dyer St Unit 17
- 40 Fir Rd Unit 386
- 5 Forsythia Ln
- 3 Dogwood Cir Unit 95
- 1 Canterbury Ln
- 1085 Union St
- 1059 Union St
- 1059 Union St
- 1059 Union St
- 1095 Union St
- 1072 Union St
- 1051 Union St
- 1079 Union St
- 1094 Union St
- 1056 Union St
- 1117 Union St
- 1049 Union St
- 1100-1102 Union St
- 1100 Union St Unit 1102
- 1048 Union St
- 1104 Union St Unit 1106
- 24 Lavina Ave
- 1119 Union St
- 1119 Union St
- 1116 Union St