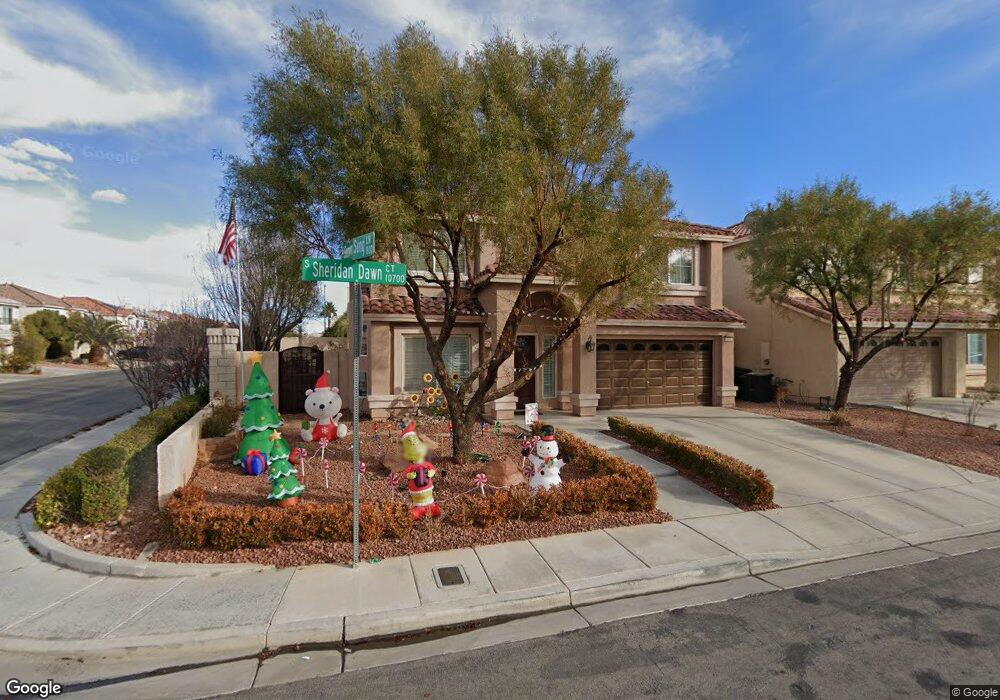
10730 Sheridan Dawn Ct Henderson, NV 89052
Silverado Ranch NeighborhoodEstimated Value: $571,000 - $595,000
4
Beds
3
Baths
2,645
Sq Ft
$220/Sq Ft
Est. Value
About This Home
This home is located at 10730 Sheridan Dawn Ct, Henderson, NV 89052 and is currently estimated at $582,037, approximately $220 per square foot. 10730 Sheridan Dawn Ct is a home located in Clark County with nearby schools including Shirley A Barber Elementary, Charles Silvestri Junior High School, and Liberty High School.
Ownership History
Date
Name
Owned For
Owner Type
Purchase Details
Closed on
Aug 27, 2012
Sold by
Harpster Deborah Marie
Bought by
Harpster Dean A
Current Estimated Value
Home Financials for this Owner
Home Financials are based on the most recent Mortgage that was taken out on this home.
Original Mortgage
$347,628
Outstanding Balance
$239,635
Interest Rate
3.49%
Mortgage Type
New Conventional
Estimated Equity
$342,402
Purchase Details
Closed on
Apr 16, 2007
Sold by
Harpster Cindy Marie
Bought by
Harpster Dean A
Purchase Details
Closed on
Sep 3, 2004
Sold by
Silverado Court 2 Inc
Bought by
Harpster Dean A and Harpster Cindy M
Home Financials for this Owner
Home Financials are based on the most recent Mortgage that was taken out on this home.
Original Mortgage
$369,200
Interest Rate
5.76%
Mortgage Type
Unknown
Create a Home Valuation Report for This Property
The Home Valuation Report is an in-depth analysis detailing your home's value as well as a comparison with similar homes in the area
Home Values in the Area
Average Home Value in this Area
Purchase History
| Date | Buyer | Sale Price | Title Company |
|---|---|---|---|
| Harpster Dean A | -- | Horizon National Title Insu | |
| Harpster Dean A | -- | None Available | |
| Harpster Dean A | $299,300 | First American Title Co |
Source: Public Records
Mortgage History
| Date | Status | Borrower | Loan Amount |
|---|---|---|---|
| Open | Harpster Dean A | $347,628 | |
| Previous Owner | Harpster Dean A | $369,200 |
Source: Public Records
Tax History Compared to Growth
Tax History
| Year | Tax Paid | Tax Assessment Tax Assessment Total Assessment is a certain percentage of the fair market value that is determined by local assessors to be the total taxable value of land and additions on the property. | Land | Improvement |
|---|---|---|---|---|
| 2025 | $2,718 | $169,453 | $49,000 | $120,453 |
| 2024 | $2,541 | $169,453 | $49,000 | $120,453 |
| 2023 | $2,153 | $154,814 | $41,650 | $113,164 |
| 2022 | $2,472 | $140,964 | $37,450 | $103,514 |
| 2021 | $2,488 | $130,515 | $32,550 | $97,965 |
| 2020 | $2,328 | $124,844 | $32,550 | $92,294 |
| 2019 | $2,260 | $112,413 | $29,400 | $83,013 |
| 2018 | $2,274 | $109,593 | $22,750 | $86,843 |
| 2017 | $3,098 | $105,648 | $21,350 | $84,298 |
| 2016 | $2,153 | $93,199 | $15,750 | $77,449 |
| 2015 | $2,074 | $87,413 | $18,900 | $68,513 |
| 2014 | $2,013 | $69,014 | $10,500 | $58,514 |
Source: Public Records
Map
Nearby Homes
- 10656 Timber Stand St
- 855 Beartooth Falls Ct
- 895 Beartooth Falls Ct
- 967 Coronado Peak Ave
- 10590 Medicine Bow St
- 10568 Salmon Leap St
- 854 Sheerwater Ave
- 1041 Grand Cerritos Ave
- 1069 Coronado Peak Ave
- 1043 Monte de Oro Ave
- 10925 Sadlers Wells St
- 10585 Pueblo Springs St
- 908 Shining Rose Place
- 10936 Shallow Water Ct
- 10769 Ackers Dr
- 867 Blushing Rose Place
- 577 Leap Frog Ave
- 681 Stone Hammer Ave
- 11014 African Sunset St
- 10968 Geyser Peak St
- 10738 Sheridan Dawn Ct
- 10729 Teton Village Ct
- 10746 Sheridan Dawn Ct
- 10737 Teton Village Ct
- 866 Socorro Song Ln
- 874 Socorro Song Ln
- 10745 Teton Village Ct
- 10735 Sheridan Dawn Ct
- 10754 Sheridan Dawn Ct
- 858 Socorro Song Ln
- 882 Socorro Song Ln
- 10743 Sheridan Dawn Ct
- 850 Socorro Song Ln
- 10753 Teton Village Ct
- 890 Socorro Song Ln
- 10762 Sheridan Dawn Ct
- 10751 Sheridan Dawn Ct
- 833 Socorro Song Ln
- 842 Socorro Song Ln
- 898 Socorro Song Ln