Estimated Value: $224,000 - $321,000
4
Beds
3
Baths
2,400
Sq Ft
$115/Sq Ft
Est. Value
About This Home
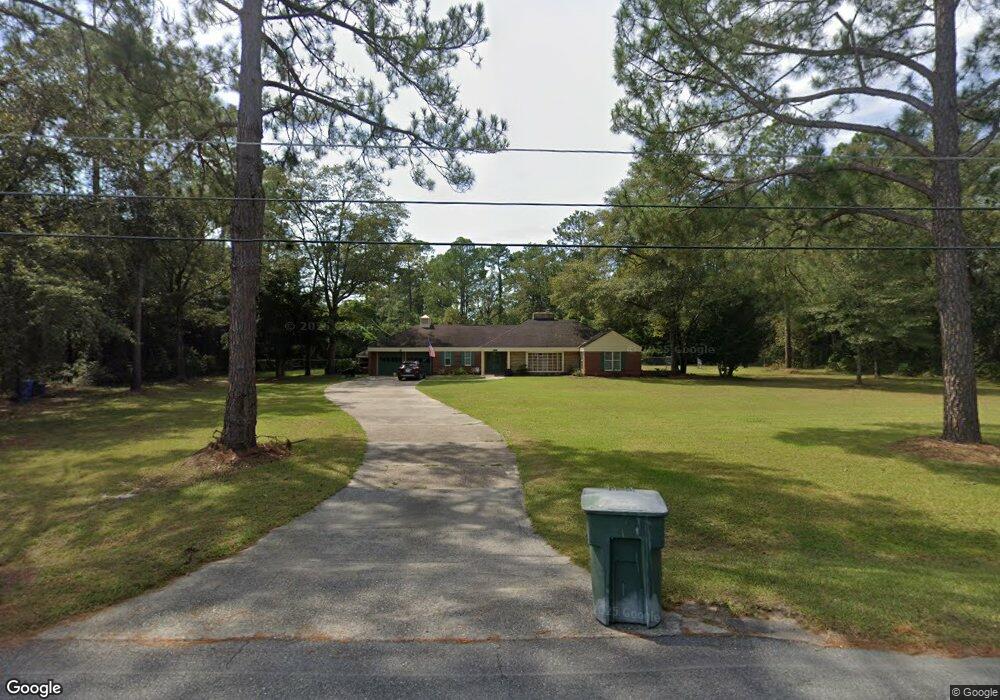
This home is located at 1074 E Plum St, Jesup, GA 31546 and is currently estimated at $274,827, approximately $114 per square foot. 1074 E Plum St is a home located in Wayne County with nearby schools including Jesup Elementary School, Arthur Williams Middle School, and Wayne County High School.
Ownership History
Date
Name
Owned For
Owner Type
Purchase Details
Closed on
Jul 7, 2021
Sold by
Oquinn Debbie Michelle
Bought by
Truax Matthew R
Current Estimated Value
Home Financials for this Owner
Home Financials are based on the most recent Mortgage that was taken out on this home.
Original Mortgage
$194,698
Outstanding Balance
$175,676
Interest Rate
2.96%
Mortgage Type
FHA
Estimated Equity
$99,151
Purchase Details
Closed on
Sep 24, 2018
Sold by
Oquinn Debby M
Bought by
Oquinn Debbie Michelle
Home Financials for this Owner
Home Financials are based on the most recent Mortgage that was taken out on this home.
Original Mortgage
$10,000,000
Interest Rate
4.5%
Mortgage Type
Commercial
Purchase Details
Closed on
Aug 1, 1991
Sold by
Quinn Debby M O
Bought by
Oquinn Debby M
Purchase Details
Closed on
Dec 1, 1988
Bought by
Quinn Debby M O
Purchase Details
Closed on
Mar 1, 1986
Purchase Details
Closed on
Sep 1, 1977
Purchase Details
Closed on
Jan 1, 1974
Create a Home Valuation Report for This Property
The Home Valuation Report is an in-depth analysis detailing your home's value as well as a comparison with similar homes in the area
Purchase History
| Date | Buyer | Sale Price | Title Company |
|---|---|---|---|
| Truax Matthew R | $215,000 | -- | |
| Oquinn Debbie Michelle | -- | -- | |
| Oquinn Debby M | $24,000 | -- | |
| Quinn Debby M O | -- | -- | |
| -- | $48,000 | -- | |
| -- | -- | -- | |
| -- | -- | -- |
Source: Public Records
Mortgage History
| Date | Status | Borrower | Loan Amount |
|---|---|---|---|
| Open | Truax Matthew R | $194,698 | |
| Previous Owner | Oquinn Debbie Michelle | $10,000,000 |
Source: Public Records
Tax History
| Year | Tax Paid | Tax Assessment Tax Assessment Total Assessment is a certain percentage of the fair market value that is determined by local assessors to be the total taxable value of land and additions on the property. | Land | Improvement |
|---|---|---|---|---|
| 2025 | $2,444 | $86,716 | $13,526 | $73,190 |
| 2024 | $2,444 | $84,250 | $13,526 | $70,724 |
| 2023 | $2,062 | $70,243 | $13,526 | $56,717 |
| 2022 | $2,211 | $70,243 | $13,526 | $56,717 |
| 2021 | $2,323 | $68,885 | $12,168 | $56,717 |
| 2020 | $2,403 | $68,885 | $12,168 | $56,717 |
| 2019 | $2,475 | $68,885 | $12,168 | $56,717 |
| 2018 | $2,475 | $68,885 | $12,168 | $56,717 |
| 2017 | $2,130 | $68,885 | $12,168 | $56,717 |
| 2016 | $2,061 | $68,885 | $12,168 | $56,717 |
| 2014 | $2,067 | $68,885 | $12,168 | $56,717 |
| 2013 | -- | $68,885 | $12,168 | $56,717 |
Source: Public Records
Map
Nearby Homes
- 412 S Willow St
- 661 E Plum St
- 111 N Mahogany St
- 123 Ivy St
- 0 E Oak St
- 241 S Elm Ln
- 524 Old Waynesville Rd
- 412 E Orange St
- 385 N Hickory St
- 945 S Palm St
- Apt E Oak St
- 705 S Elm St
- 548 N Cypress St
- 286 S Wayne St
- 766 Oak Villa Dr
- 687 Harper St
- 985 Seven Oaks Rd
- 655 Littlefield St
- 187 E Pine St
- 1101 S Palm St
Your Personal Tour Guide
Ask me questions while you tour the home.