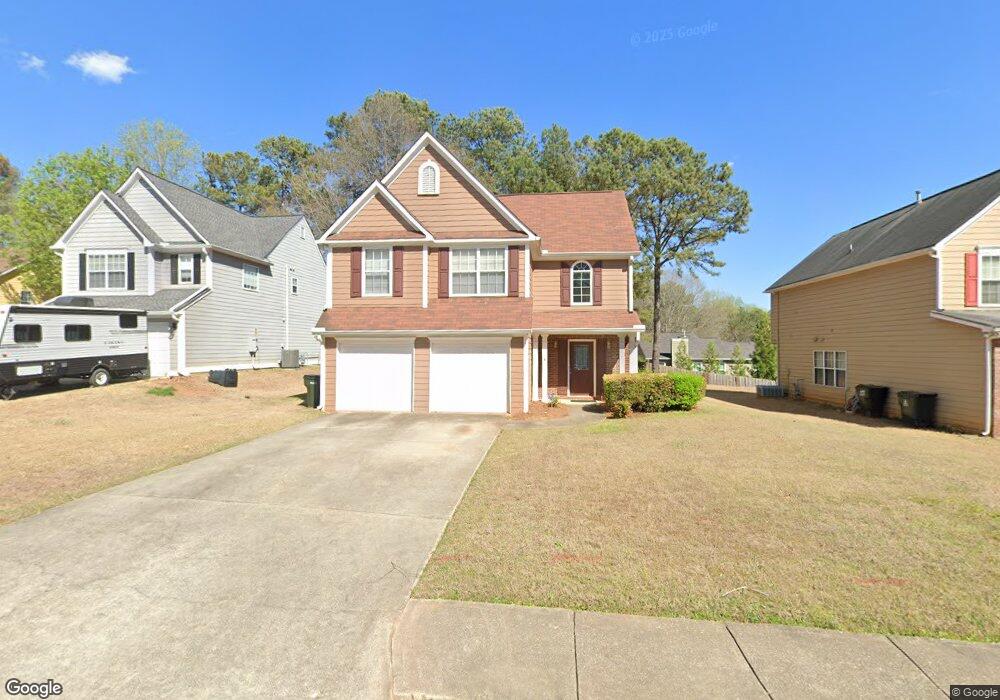
1074 Litchfield Way SW Marietta, GA 30060
Southwestern Marietta NeighborhoodEstimated Value: $353,000 - $373,000
3
Beds
3
Baths
1,807
Sq Ft
$202/Sq Ft
Est. Value
About This Home
This home is located at 1074 Litchfield Way SW, Marietta, GA 30060 and is currently estimated at $364,547, approximately $201 per square foot. 1074 Litchfield Way SW is a home located in Cobb County with nearby schools including Russell Elementary School, Floyd Middle School, and Osborne High School.
Ownership History
Date
Name
Owned For
Owner Type
Purchase Details
Closed on
Jul 24, 2009
Sold by
Jpmc Specialty Mtg Llc
Bought by
Hurst Felicia L
Current Estimated Value
Home Financials for this Owner
Home Financials are based on the most recent Mortgage that was taken out on this home.
Original Mortgage
$90,824
Outstanding Balance
$59,696
Interest Rate
5.53%
Mortgage Type
FHA
Estimated Equity
$304,851
Purchase Details
Closed on
May 6, 2009
Sold by
Santos Jose L
Bought by
Jpmc Specialty Mtg Llc
Purchase Details
Closed on
Dec 21, 2000
Sold by
Greenblatt Richard J and Greenblatt Michelle M
Bought by
Santos Jose L
Home Financials for this Owner
Home Financials are based on the most recent Mortgage that was taken out on this home.
Original Mortgage
$116,100
Interest Rate
7.72%
Mortgage Type
New Conventional
Purchase Details
Closed on
Nov 30, 1994
Sold by
Torrey S G Atlanta Ltd
Bought by
Greenblatt Richard J
Home Financials for this Owner
Home Financials are based on the most recent Mortgage that was taken out on this home.
Original Mortgage
$110,150
Interest Rate
9.01%
Mortgage Type
FHA
Create a Home Valuation Report for This Property
The Home Valuation Report is an in-depth analysis detailing your home's value as well as a comparison with similar homes in the area
Home Values in the Area
Average Home Value in this Area
Purchase History
| Date | Buyer | Sale Price | Title Company |
|---|---|---|---|
| Hurst Felicia L | $92,500 | -- | |
| Jpmc Specialty Mtg Llc | $63,835 | -- | |
| Santos Jose L | $129,000 | -- | |
| Greenblatt Richard J | $112,900 | -- |
Source: Public Records
Mortgage History
| Date | Status | Borrower | Loan Amount |
|---|---|---|---|
| Open | Hurst Felicia L | $90,824 | |
| Previous Owner | Santos Jose L | $116,100 | |
| Previous Owner | Greenblatt Richard J | $110,150 |
Source: Public Records
Tax History Compared to Growth
Tax History
| Year | Tax Paid | Tax Assessment Tax Assessment Total Assessment is a certain percentage of the fair market value that is determined by local assessors to be the total taxable value of land and additions on the property. | Land | Improvement |
|---|---|---|---|---|
| 2025 | $3,274 | $140,900 | $24,000 | $116,900 |
| 2024 | $3,277 | $140,900 | $24,000 | $116,900 |
| 2023 | $2,257 | $118,900 | $12,000 | $106,900 |
| 2022 | $2,415 | $100,348 | $12,000 | $88,348 |
| 2021 | $2,119 | $86,820 | $12,000 | $74,820 |
| 2020 | $1,741 | $69,520 | $7,200 | $62,320 |
| 2019 | $1,741 | $69,520 | $7,200 | $62,320 |
| 2018 | $1,741 | $69,520 | $7,200 | $62,320 |
| 2017 | $1,441 | $59,316 | $7,200 | $52,116 |
| 2016 | $1,132 | $48,264 | $7,200 | $41,064 |
| 2015 | $1,162 | $48,264 | $7,200 | $41,064 |
| 2014 | $945 | $40,624 | $0 | $0 |
Source: Public Records
Map
Nearby Homes
- 1075 Litchfield Way SW
- 3821 Majestic Ln SW
- 1430 Settlers Walk Way SW Unit 13
- 1121 Neva Dr SW
- 3408 Double Eagle Dr Unit 28
- 3383 Raes Creek Rd Unit 4
- 1471 Settlers Walk Way SW Unit 5
- 3601 Kelsey Chase Ct
- 1000 Carlton Way SW
- 3309 Raes Creek Rd Unit 13
- 971 Canyon Trail SW
- 1315 Yates Ave
- 1075 Lanier Dr SW
- 1225 Creek Forest Ln
- 1245 Creek Forest Ln Unit 8
- 1249 Creek Forest Ln Unit 8
- 3517 Greenway Dr SW
- 1072 Litchfield Way SW
- 1076 Litchfield Way SW
- 3708 Majestic Dr SW
- 3710 Majestic Dr SW
- 1070 Litchfield Way SW
- 1078 Litchfield Way SW
- 1077 Litchfield Way SW Unit 149
- 1077 Litchfield Way SW
- 1079 Litchfield Way SW
- 3712 Majestic Dr SW
- 3706 Majestic Dr SW
- 1080 Litchfield Way SW
- 1068 Litchfield Way SW
- 1081 Litchfield Way SW
- 1082 Litchfield Way SW
- 1073 Litchfield Way SW
- 3704 Majestic Dr SW
- 3714 Majestic Dr SW
- 1066 Litchfield Way SW
- 1083 Litchfield Way SW