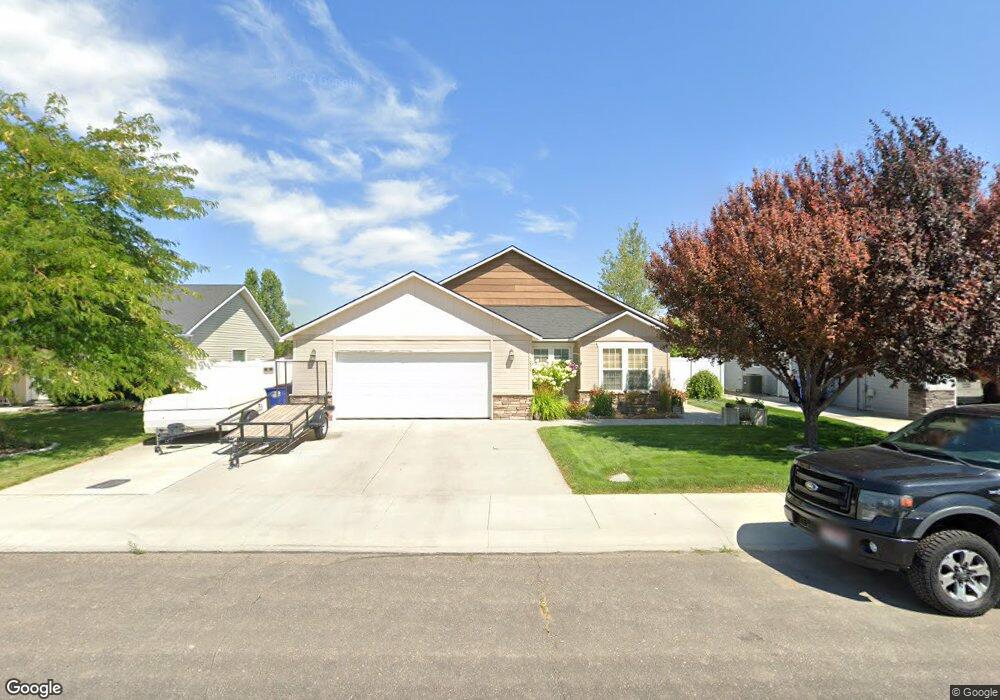
1074 Starlight Loop Twin Falls, ID 83301
Estimated Value: $358,000 - $400,000
3
Beds
2
Baths
1,534
Sq Ft
$245/Sq Ft
Est. Value
About This Home
This home is located at 1074 Starlight Loop, Twin Falls, ID 83301 and is currently estimated at $375,262, approximately $244 per square foot. 1074 Starlight Loop is a home located in Twin Falls County with nearby schools including Rock Creek Elementary School, Robert Stuart Junior High School, and Canyon Ridge High School.
Ownership History
Date
Name
Owned For
Owner Type
Purchase Details
Closed on
Nov 4, 2014
Sold by
Spells Cassie S and Spells Jeremy N
Bought by
Spells Jeremy N
Current Estimated Value
Purchase Details
Closed on
Jun 6, 2014
Sold by
Spells Cassie S
Bought by
Spells Jeremy N
Purchase Details
Closed on
Oct 16, 2007
Sold by
Wolverton Development & Construction Inc
Bought by
Spells Jeremy and Chapin Cassie
Home Financials for this Owner
Home Financials are based on the most recent Mortgage that was taken out on this home.
Original Mortgage
$185,784
Outstanding Balance
$116,343
Interest Rate
6.27%
Mortgage Type
FHA
Estimated Equity
$258,919
Purchase Details
Closed on
Jul 26, 2007
Sold by
Brehm Robert and Brehm Dolores
Bought by
City Of Twin Falls
Purchase Details
Closed on
Jan 1, 2007
Sold by
Guerry Inc
Bought by
Mark J Guerry Enterprises Inc
Create a Home Valuation Report for This Property
The Home Valuation Report is an in-depth analysis detailing your home's value as well as a comparison with similar homes in the area
Purchase History
| Date | Buyer | Sale Price | Title Company |
|---|---|---|---|
| Spells Jeremy N | -- | Alliance Title | |
| Spells Jeremy N | -- | None Available | |
| Spells Jeremy | -- | Alliance Title | |
| City Of Twin Falls | -- | None Available | |
| Mark J Guerry Enterprises Inc | -- | None Available |
Source: Public Records
Mortgage History
| Date | Status | Borrower | Loan Amount |
|---|---|---|---|
| Open | Spells Jeremy | $185,784 |
Source: Public Records
Tax History
| Year | Tax Paid | Tax Assessment Tax Assessment Total Assessment is a certain percentage of the fair market value that is determined by local assessors to be the total taxable value of land and additions on the property. | Land | Improvement |
|---|---|---|---|---|
| 2025 | $1,855 | $319,612 | $59,991 | $259,621 |
| 2024 | $1,838 | $319,612 | $59,991 | $259,621 |
| 2023 | $1,741 | $335,636 | $59,991 | $275,645 |
| 2022 | $2,531 | $346,026 | $56,869 | $289,157 |
| 2021 | $2,265 | $275,432 | $61,860 | $213,572 |
| 2020 | $2,105 | $237,988 | $56,869 | $181,119 |
| 2019 | $2,368 | $232,529 | $52,404 | $180,125 |
| 2018 | $2,111 | $211,763 | $30,208 | $181,555 |
| 2017 | $1,810 | $193,096 | $30,208 | $162,888 |
| 2016 | $1,696 | $169,270 | $0 | $0 |
| 2015 | $1,651 | $169,270 | $30,208 | $139,062 |
| 2012 | -- | $136,072 | $0 | $0 |
Source: Public Records
Map
Nearby Homes
- 1085 Easy Ave
- 1087 Easy Ave
- 1153 Terra Ave
- 1378 Misty Meadows Ct
- 1182 Sunnybrook Ave
- 1123 Frank Henry Rd
- 1265 Terra Ave
- 1139 Frank Henry Rd
- 891 N Pointe Dr
- 1122 Crestview Dr
- 1228 Creekside Way
- 1143 Langford Way
- 1196 Creekside Way
- 1295 Starlight Loop
- 1231 Frank Henry Rd
- 1187 Crestview Dr
- 1229 Crestview Dr
- 1210 Ira Burton Rd Unit Lot 21 Block 12
- 1266 Crestview Dr
- 893 Shadowleaf Ave
- 1064 Starlight Loop
- 1084 Starlight Loop
- 1139 W North College Rd
- 1079 N College Rd W
- 1081 N College Rd W
- 1063 N College Rd W
- 1065 N College Rd W
- 1096 Starlight Loop
- 1073 Starlight Loop
- 1097 N College Drive Rd W
- 1085 Starlight Loop
- 1061 Starlight Loop
- 1095 N College Rd W
- 1095 W North College Rd
- 1095 Starlight Loop
- 1051 Starlight Loop
- 1080 Terra Ave
- 1041 Starlight Loop
- 1090 Terra Ave
- 1068 Terra Ave
Your Personal Tour Guide
Ask me questions while you tour the home.