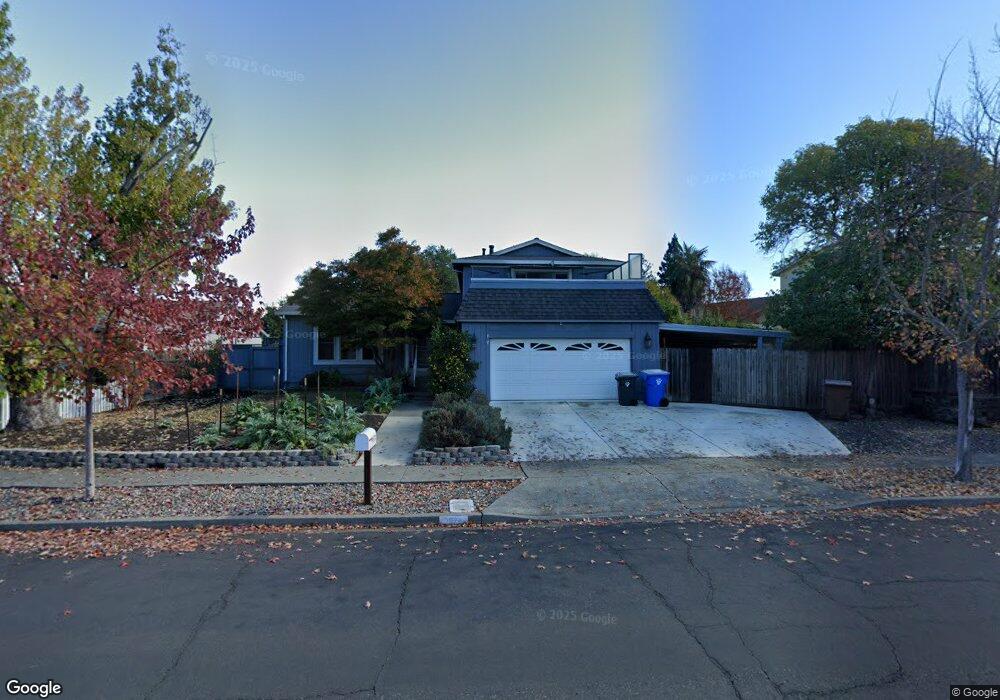
1074 Westview Dr Napa, CA 94558
Browns Valley NeighborhoodEstimated Value: $956,000 - $1,165,000
4
Beds
3
Baths
2,307
Sq Ft
$475/Sq Ft
Est. Value
About This Home
This home is located at 1074 Westview Dr, Napa, CA 94558 and is currently estimated at $1,095,055, approximately $474 per square foot. 1074 Westview Dr is a home located in Napa County with nearby schools including Browns Valley Elementary School, Redwood Middle School, and Napa High School.
Ownership History
Date
Name
Owned For
Owner Type
Purchase Details
Closed on
Oct 3, 2018
Sold by
Mitchell Jamie M
Bought by
Mitchell Jamie M and Breit Daniel L
Current Estimated Value
Purchase Details
Closed on
Feb 6, 2018
Sold by
Mitchell Jamie M and Walker Jamie M
Bought by
Mitchell Jamie N
Home Financials for this Owner
Home Financials are based on the most recent Mortgage that was taken out on this home.
Original Mortgage
$585,520
Outstanding Balance
$502,426
Interest Rate
4.62%
Mortgage Type
FHA
Estimated Equity
$592,629
Purchase Details
Closed on
Feb 5, 2018
Sold by
Walker Jon D
Bought by
Mitchell Jamie M and Walker Jamie M
Home Financials for this Owner
Home Financials are based on the most recent Mortgage that was taken out on this home.
Original Mortgage
$585,520
Outstanding Balance
$502,426
Interest Rate
4.62%
Mortgage Type
FHA
Estimated Equity
$592,629
Purchase Details
Closed on
Sep 19, 2013
Sold by
Hulsey Thomas C and Hulsey Donita Jo
Bought by
Walker Jon D and Walker Jamie M
Home Financials for this Owner
Home Financials are based on the most recent Mortgage that was taken out on this home.
Original Mortgage
$481,124
Interest Rate
4.37%
Mortgage Type
FHA
Purchase Details
Closed on
Apr 23, 2010
Sold by
Hulsey Thomas C and Hulsey Donita Jo
Bought by
Hulsey Thomas C and Hulsey Donita Jo
Create a Home Valuation Report for This Property
The Home Valuation Report is an in-depth analysis detailing your home's value as well as a comparison with similar homes in the area
Home Values in the Area
Average Home Value in this Area
Purchase History
| Date | Buyer | Sale Price | Title Company |
|---|---|---|---|
| Mitchell Jamie M | -- | None Available | |
| Mitchell Jamie N | -- | First American Title Co | |
| Mitchell Jamie M | -- | None Available | |
| Walker Jon D | $490,000 | Fidelity National Title Comp | |
| Hulsey Thomas C | -- | None Available |
Source: Public Records
Mortgage History
| Date | Status | Borrower | Loan Amount |
|---|---|---|---|
| Open | Mitchell Jamie M | $585,520 | |
| Closed | Walker Jon D | $481,124 | |
| Closed | Mitchell Jamie M | $0 |
Source: Public Records
Tax History
| Year | Tax Paid | Tax Assessment Tax Assessment Total Assessment is a certain percentage of the fair market value that is determined by local assessors to be the total taxable value of land and additions on the property. | Land | Improvement |
|---|---|---|---|---|
| 2025 | $8,897 | $718,647 | $364,072 | $354,575 |
| 2024 | $8,610 | $704,557 | $356,934 | $347,623 |
| 2023 | $8,610 | $690,743 | $349,936 | $340,807 |
| 2022 | $8,353 | $677,200 | $343,075 | $334,125 |
| 2021 | $8,238 | $663,923 | $336,349 | $327,574 |
| 2020 | $8,178 | $657,117 | $332,901 | $324,216 |
| 2019 | $8,011 | $644,233 | $326,374 | $317,859 |
| 2018 | $6,729 | $527,907 | $247,793 | $280,114 |
| 2017 | $6,593 | $517,557 | $242,935 | $274,622 |
| 2016 | $6,463 | $507,410 | $238,172 | $269,238 |
| 2015 | $6,048 | $499,789 | $234,595 | $265,194 |
| 2014 | $5,958 | $490,000 | $230,000 | $260,000 |
Source: Public Records
Map
Nearby Homes
- 1091 Century Dr
- 3337 Kensington Cir
- 1019 Westview Dr
- 1125 Westview Dr
- 29 Forest Dr
- 1135 Pinewood Dr
- 35 Forest Ln
- 3391 Ellen Way
- 2941 Brookwood Dr
- 1040 Mccormick Ln
- 4048 Browns Valley Rd
- 2 Remington Ct
- 2539 Rollingwood Dr
- 115 Waterstone Ct
- 1051 Vassar Dr
- 2470 W Pueblo Ave
- 4155 Casper Way
- 100 Waterstone Ct
- 2510 Redwood Rd
- 3051 Redwood Rd
- 1086 Westview Dr
- 3322 Anita Ct
- 3324 Anita Ct
- 3320 Anita Ct
- 3325 Scenic Dr
- 1098 Westview Dr
- 1075 Westview Dr
- 1071 Westview Dr
- 1087 Westview Dr
- 3323 Scenic Dr
- 1067 Westview Dr
- 1099 Westview Dr
- 3323 Anita Ct
- 3321 Scenic Dr
- 3316 Anita Ct
- 3325 Anita Ct
- 3321 Anita Ct
- 1063 Westview Dr
- 1092 Century Dr
- 1080 Century Dr
Your Personal Tour Guide
Ask me questions while you tour the home.