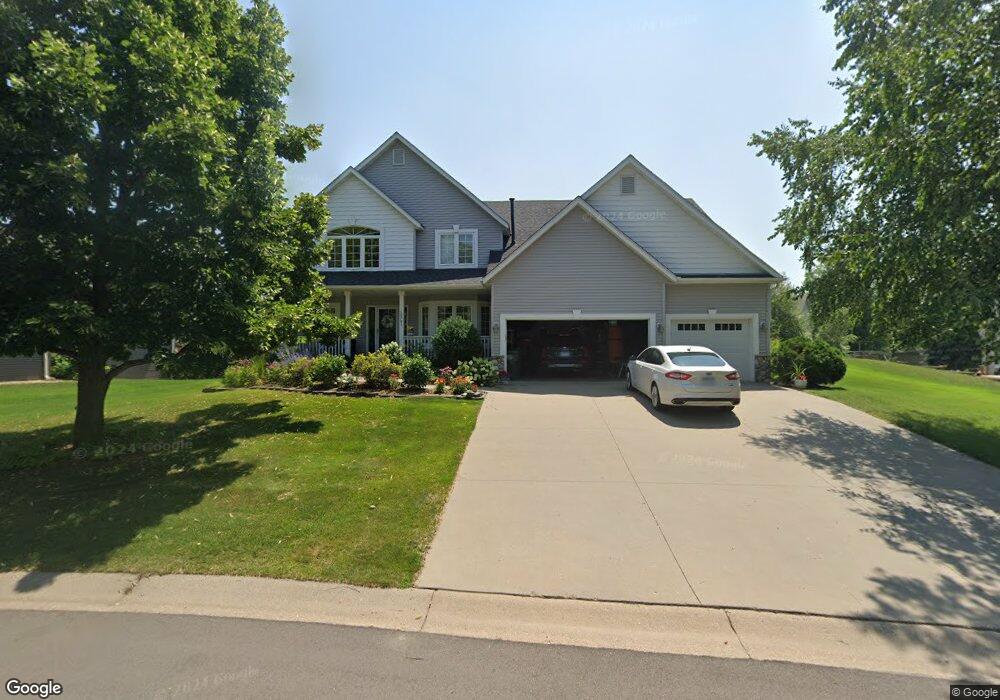
10741 Amherst Way Inver Grove Heights, MN 55077
Estimated Value: $625,000 - $794,000
5
Beds
4
Baths
2,584
Sq Ft
$264/Sq Ft
Est. Value
About This Home
This home is located at 10741 Amherst Way, Inver Grove Heights, MN 55077 and is currently estimated at $681,563, approximately $263 per square foot. 10741 Amherst Way is a home located in Dakota County with nearby schools including Red Pine Elementary School, Rosemount Middle School, and Rosemount Senior High School.
Ownership History
Date
Name
Owned For
Owner Type
Purchase Details
Closed on
Jun 20, 2006
Sold by
Johnson M William and Johnson Maureen K
Bought by
Fritschel James R and Fritschel Colleen
Current Estimated Value
Purchase Details
Closed on
Apr 6, 2006
Sold by
Doobay Totara M
Bought by
Johnson Maureen K and William Johnson M
Purchase Details
Closed on
Jun 18, 2001
Sold by
Mw Johnson Construction
Bought by
Doobay Devi and Doobay Totaram
Purchase Details
Closed on
Aug 1, 2000
Sold by
Lyman Dev Co
Bought by
M W Johnson Const Inc
Create a Home Valuation Report for This Property
The Home Valuation Report is an in-depth analysis detailing your home's value as well as a comparison with similar homes in the area
Home Values in the Area
Average Home Value in this Area
Purchase History
| Date | Buyer | Sale Price | Title Company |
|---|---|---|---|
| Fritschel James R | $449,900 | -- | |
| Johnson Maureen K | $440,000 | -- | |
| Doobay Devi | $358,601 | -- | |
| M W Johnson Const Inc | $62,900 | -- |
Source: Public Records
Tax History Compared to Growth
Tax History
| Year | Tax Paid | Tax Assessment Tax Assessment Total Assessment is a certain percentage of the fair market value that is determined by local assessors to be the total taxable value of land and additions on the property. | Land | Improvement |
|---|---|---|---|---|
| 2024 | $7,740 | $579,100 | $129,900 | $449,200 |
| 2023 | $7,740 | $551,400 | $126,600 | $424,800 |
| 2022 | $6,128 | $535,600 | $126,400 | $409,200 |
| 2021 | $6,030 | $477,900 | $109,900 | $368,000 |
| 2020 | $6,164 | $465,600 | $104,700 | $360,900 |
| 2019 | $5,595 | $463,400 | $99,700 | $363,700 |
| 2018 | $5,591 | $432,000 | $95,000 | $337,000 |
| 2017 | $5,671 | $431,300 | $90,400 | $340,900 |
| 2016 | $5,549 | $420,600 | $86,200 | $334,400 |
| 2015 | $5,209 | $414,800 | $84,100 | $330,700 |
| 2014 | -- | $397,125 | $80,721 | $316,404 |
| 2013 | -- | $355,705 | $74,496 | $281,209 |
Source: Public Records
Map
Nearby Homes
- 10612 Alison Way
- 10684 Alameda Ave
- 10668 Alton Ct
- 10787 Alison Way
- 4525 Alicia Dr
- 10064 Adam Ave
- 676 N Hay Lake Rd
- 4168 Countryview Dr
- 11700 Azure Ln
- 591 Autumn Oaks Ct
- 695 Rosa Ct
- 4829 Redpoll Ct
- 11784 Azure Ln
- 11735 Azure Cir
- 11732 Azure Cir
- 11798 Azure Ln
- 4837 Avery Ct
- 4860 Avery Ct
- 9380 Aladin Trail
- 4902 Brooklyn Ln
- 10745 Amherst Way
- 10627 Alison Way
- 10783 Amherst Way
- 10785 Amherst Way
- 10749 Amherst Way
- 10781 Amherst Way
- 10744 Amherst Way
- 10740 Amherst Way
- 10746 Amherst Way
- 10753 Amherst Way
- 10748 Amherst Way
- 10777 Amherst Way
- 10632 Alison Way
- 10636 Alison Way
- 10643 Alison Way
- 10752 Amherst Way
- 10624 Alison Way
- 10628 Alison Way
- 10782 Amherst Way
- 10620 Alison Way