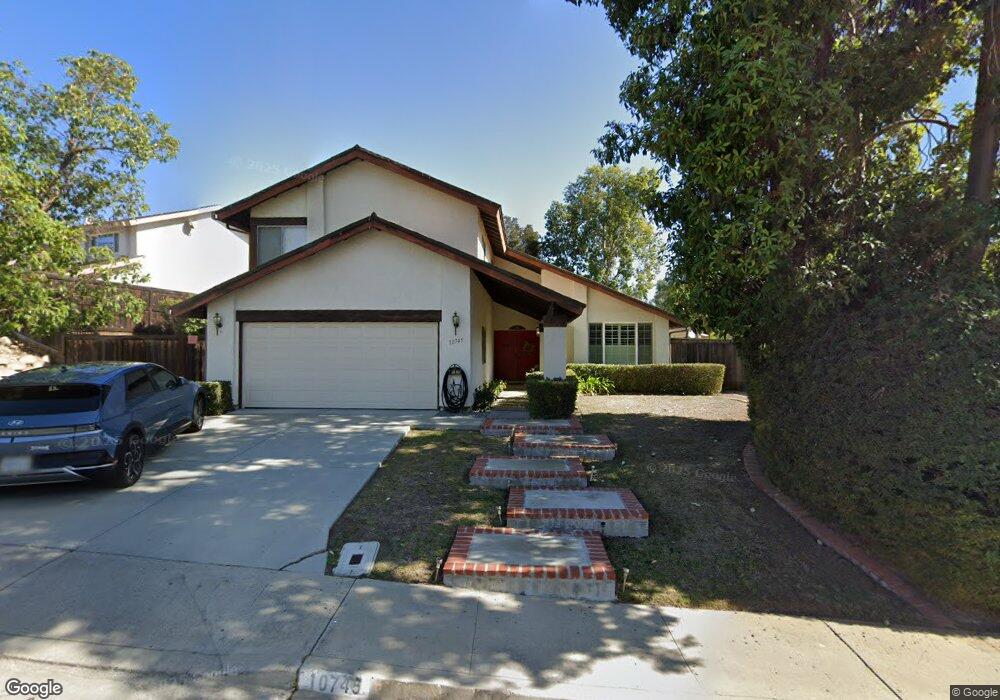
10745 Charbono Terrace San Diego, CA 92131
Scripps Ranch NeighborhoodEstimated Value: $1,614,000 - $1,687,000
4
Beds
4
Baths
2,600
Sq Ft
$637/Sq Ft
Est. Value
About This Home
This home is located at 10745 Charbono Terrace, San Diego, CA 92131 and is currently estimated at $1,656,234, approximately $637 per square foot. 10745 Charbono Terrace is a home located in San Diego County with nearby schools including Jerabek Elementary School, Thurgood Marshall Middle School, and Scripps Ranch High School.
Ownership History
Date
Name
Owned For
Owner Type
Purchase Details
Closed on
Nov 9, 2005
Sold by
Ala Paul
Bought by
Christiansen Cynthia L
Current Estimated Value
Home Financials for this Owner
Home Financials are based on the most recent Mortgage that was taken out on this home.
Original Mortgage
$632,000
Outstanding Balance
$346,919
Interest Rate
6.07%
Mortgage Type
New Conventional
Estimated Equity
$1,309,315
Purchase Details
Closed on
Jun 2, 2000
Sold by
Christiansen Cynthia L and Ala Paul
Bought by
Christiansen Cynthia L
Purchase Details
Closed on
Nov 4, 1996
Sold by
Talipsky Richard W and Talipsky Donna M
Bought by
Christiansen Cynthia L
Home Financials for this Owner
Home Financials are based on the most recent Mortgage that was taken out on this home.
Original Mortgage
$151,000
Interest Rate
7.59%
Mortgage Type
Balloon
Purchase Details
Closed on
Aug 10, 1987
Purchase Details
Closed on
Jan 28, 1985
Create a Home Valuation Report for This Property
The Home Valuation Report is an in-depth analysis detailing your home's value as well as a comparison with similar homes in the area
Home Values in the Area
Average Home Value in this Area
Purchase History
| Date | Buyer | Sale Price | Title Company |
|---|---|---|---|
| Christiansen Cynthia L | -- | Commonwealth Title | |
| Christiansen Cynthia L | -- | Fidelity National Title | |
| Christiansen Cynthia L | $236,000 | Continental Lawyers Title | |
| -- | $223,000 | -- | |
| -- | $184,000 | -- |
Source: Public Records
Mortgage History
| Date | Status | Borrower | Loan Amount |
|---|---|---|---|
| Open | Christiansen Cynthia L | $632,000 | |
| Previous Owner | Christiansen Cynthia L | $151,000 | |
| Closed | Christiansen Cynthia L | $0 |
Source: Public Records
Tax History Compared to Growth
Tax History
| Year | Tax Paid | Tax Assessment Tax Assessment Total Assessment is a certain percentage of the fair market value that is determined by local assessors to be the total taxable value of land and additions on the property. | Land | Improvement |
|---|---|---|---|---|
| 2025 | $5,420 | $436,053 | $146,570 | $289,483 |
| 2024 | $5,420 | $427,504 | $143,697 | $283,807 |
| 2023 | $5,293 | $419,123 | $140,880 | $278,243 |
| 2022 | $5,142 | $410,906 | $138,118 | $272,788 |
| 2021 | $5,095 | $402,850 | $135,410 | $267,440 |
| 2020 | $5,032 | $398,720 | $134,022 | $264,698 |
| 2019 | $4,940 | $390,903 | $131,395 | $259,508 |
| 2018 | $4,623 | $383,239 | $128,819 | $254,420 |
| 2017 | $80 | $375,726 | $126,294 | $249,432 |
| 2016 | $4,437 | $368,360 | $123,818 | $244,542 |
| 2015 | $4,369 | $362,828 | $121,959 | $240,869 |
| 2014 | $4,300 | $355,721 | $119,570 | $236,151 |
Source: Public Records
Map
Nearby Homes
- 12026 Medoc Ln
- 10575 Spruce Grove Ave
- 10976 Caminito Alto
- 12432 Caminito Brioso
- 11393 Vista Elevada
- 11495 Cypress Canyon Rd
- 10304 Spruce Grove Ave
- 11787 La Colina Rd
- 10405 White Birch Dr
- 10616 Falcon Rim Point
- 11721 Treadwell Dr
- 11793 Alderhill Terrace
- 12516 Rougemont Place
- 11646 La Colina Rd
- 11766 Treadwell Dr
- 11313 Wild Meadow Place
- 10415 Mesa Madera Dr
- 11964 Ashley Place
- 10535 Arbor Park Place
- 13303 Greenstone Ct
- 10755 Charbono Terrace
- 10737 Charbono Terrace
- 10716 Riesling Dr
- 10763 Charbono Terrace
- 10702 Riesling Dr
- 10730 Riesling Dr
- 10742 Charbono Terrace
- 10732 Charbono Terrace
- 10744 Riesling Dr
- 10694 Riesling Dr
- 10771 Charbono Terrace
- 10752 Charbono Terrace
- 10719 Charbono Terrace
- 10720 Charbono Terrace
- 10762 Charbono Terrace
- 10758 Riesling Dr
- 10772 Charbono Terrace
- 10678 Riesling Dr
- 10781 Charbono Terrace
- 10772 Riesling Dr