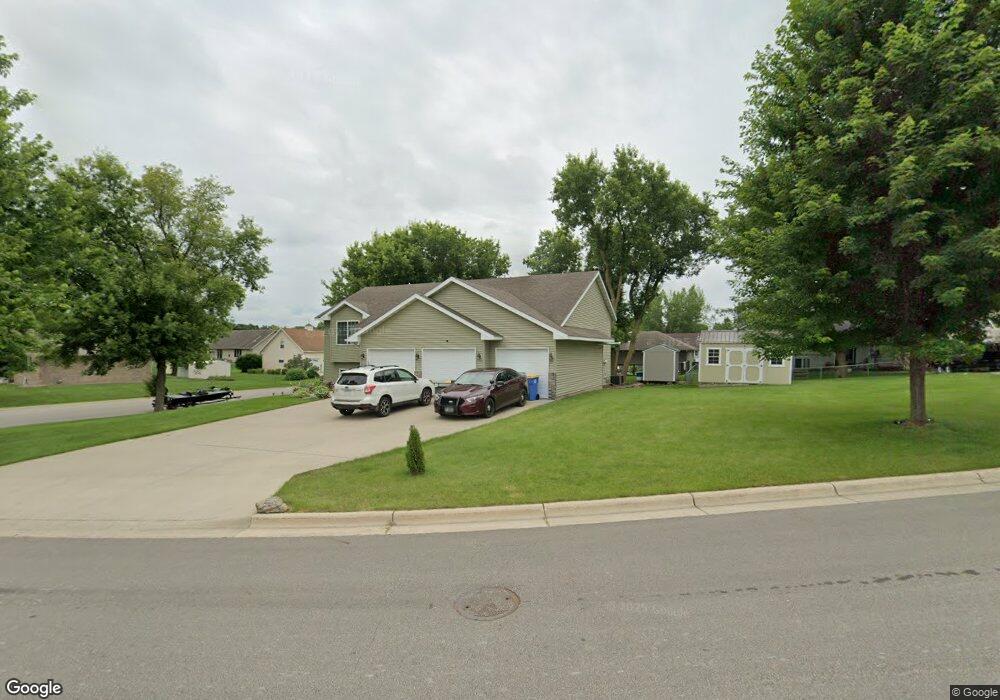
1075 20th St NE Owatonna, MN 55060
Estimated Value: $342,000 - $388,000
3
Beds
3
Baths
2,194
Sq Ft
$167/Sq Ft
Est. Value
About This Home
This home is located at 1075 20th St NE, Owatonna, MN 55060 and is currently estimated at $365,560, approximately $166 per square foot. 1075 20th St NE is a home located in Steele County with nearby schools including McKinley Elementary School, Owatonna Middle School, and Owatonna Senior High School.
Ownership History
Date
Name
Owned For
Owner Type
Purchase Details
Closed on
Jun 8, 2015
Sold by
Scholljegerdes Chandra R and Scholljegerdes James
Bought by
Santos Santiago J
Current Estimated Value
Home Financials for this Owner
Home Financials are based on the most recent Mortgage that was taken out on this home.
Original Mortgage
$184,300
Outstanding Balance
$126,115
Interest Rate
0.78%
Mortgage Type
New Conventional
Estimated Equity
$239,445
Purchase Details
Closed on
Sep 5, 2008
Sold by
Schrom Construction Inc
Bought by
Dewar Chandra R
Home Financials for this Owner
Home Financials are based on the most recent Mortgage that was taken out on this home.
Original Mortgage
$172,380
Interest Rate
6.55%
Mortgage Type
New Conventional
Purchase Details
Closed on
Sep 28, 2007
Sold by
R K & T Development
Bought by
Schrom Construction Inc
Home Financials for this Owner
Home Financials are based on the most recent Mortgage that was taken out on this home.
Original Mortgage
$125,000
Interest Rate
6.49%
Mortgage Type
Purchase Money Mortgage
Purchase Details
Closed on
Jan 26, 2007
Sold by
Tollefson Development Inc
Bought by
Rk & T Development
Create a Home Valuation Report for This Property
The Home Valuation Report is an in-depth analysis detailing your home's value as well as a comparison with similar homes in the area
Home Values in the Area
Average Home Value in this Area
Purchase History
| Date | Buyer | Sale Price | Title Company |
|---|---|---|---|
| Santos Santiago J | $194,000 | -- | |
| Dewar Chandra R | $169,000 | None Available | |
| Schrom Construction Inc | $30,000 | None Available | |
| Rk & T Development | $112,500 | United Title Inc |
Source: Public Records
Mortgage History
| Date | Status | Borrower | Loan Amount |
|---|---|---|---|
| Open | Santos Santiago J | $184,300 | |
| Previous Owner | Dewar Chandra R | $172,380 | |
| Previous Owner | Schrom Construction Inc | $125,000 |
Source: Public Records
Tax History Compared to Growth
Tax History
| Year | Tax Paid | Tax Assessment Tax Assessment Total Assessment is a certain percentage of the fair market value that is determined by local assessors to be the total taxable value of land and additions on the property. | Land | Improvement |
|---|---|---|---|---|
| 2025 | $5,006 | $372,300 | $88,600 | $283,700 |
| 2024 | $5,002 | $347,400 | $75,900 | $271,500 |
| 2023 | $4,612 | $337,400 | $73,000 | $264,400 |
| 2022 | $3,998 | $298,600 | $48,900 | $249,700 |
| 2021 | $3,788 | $236,278 | $42,630 | $193,648 |
| 2020 | $3,834 | $222,558 | $42,630 | $179,928 |
| 2019 | $3,406 | $216,090 | $42,630 | $173,460 |
| 2018 | $3,170 | $205,506 | $42,630 | $162,876 |
| 2017 | $2,996 | $192,472 | $31,948 | $160,524 |
| 2016 | $2,936 | $184,142 | $31,948 | $152,194 |
| 2015 | -- | $0 | $0 | $0 |
| 2014 | -- | $0 | $0 | $0 |
Source: Public Records
Map
Nearby Homes
- 1299 Bellflower Ln NE
- 1251 Bellflower Ln NE
- 1231 Bellflower Ln NE
- 1239 Bellflower Ln NE
- 1270 Bellflower Ln NE
- 2055 Bigelow Ave
- 1215 Bellflower Ln
- TBD Mineral Springs Pkwy NE
- 2215 Condor Place
- XXXX Prairie Ln NE
- 720 22nd St NE
- 1325 Mineral Springs Rd
- 1880 Kenyon Rd
- 2075 Hemlock Ave NE
- 630 23rd St NE
- 1560 Gray Fox Dr NE
- 885 Lee St NE
- 475 Willow Creek Dr
- 655 Lee St NE
- 1808 Creekside Dr NE
- 1990 Prairie Ln NE
- 1986 Prairie Ln NE
- 1135 20th St NE
- 1090 20th St NE
- 1966 Prairie Ln NE
- 1030 20th St NE
- 1299 Bellflower Ln
- 1030 1030 20th-Street-ne
- 1165 20th St NE
- 2080 Prairie Place NE
- 2045 Prairie Place NE
- 1946 Prairie Ln NE
- 1295 Bellflower Ln
- 1975 Prairie Ln NE
- 1975 1975 Prairie-Lane-ne
- 1946 Prairie Ln NE
- 1010 20th St NE
- 1929 Hemlock Ave
- 2045 Hemlock Ave
- 1195 20th St NE