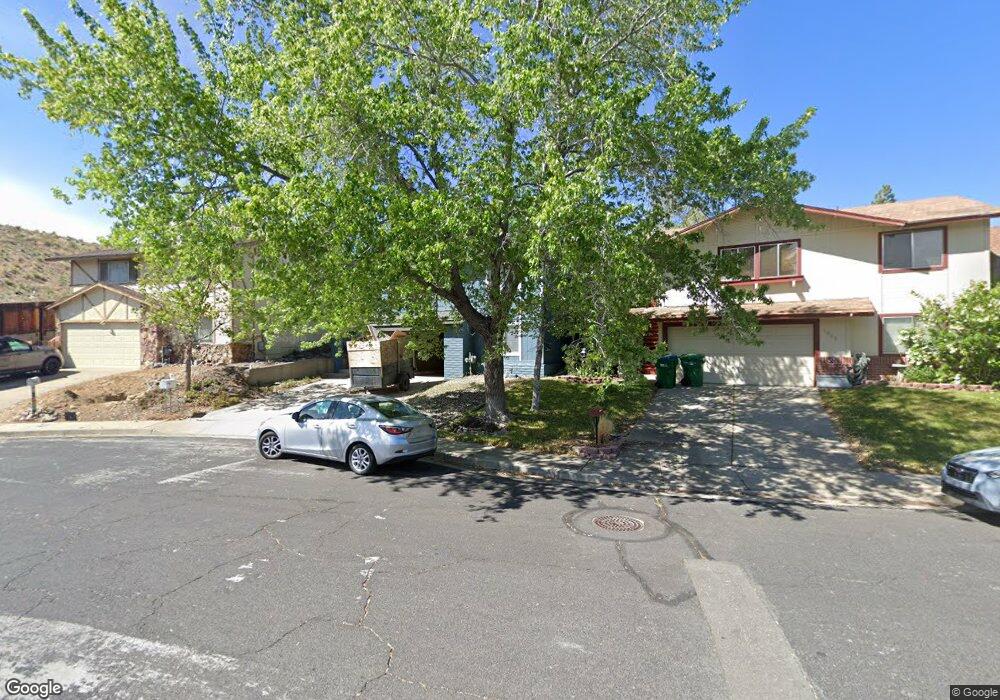
1075 Braddock Ct Unit 2 Reno, NV 89503
Kings Row NeighborhoodEstimated Value: $460,000 - $515,000
3
Beds
3
Baths
1,652
Sq Ft
$297/Sq Ft
Est. Value
About This Home
This home is located at 1075 Braddock Ct Unit 2, Reno, NV 89503 and is currently estimated at $490,527, approximately $296 per square foot. 1075 Braddock Ct Unit 2 is a home located in Washoe County with nearby schools including Elmcrest Elementary School, Archie Clayton Pre-AP Academy, and Robert McQueen High School.
Ownership History
Date
Name
Owned For
Owner Type
Purchase Details
Closed on
Aug 4, 2011
Sold by
Makris Dimitrios
Bought by
Makris Dimitrios and Makris Olga
Current Estimated Value
Purchase Details
Closed on
Aug 2, 2011
Sold by
Makris Olga
Bought by
Makris Dimitrios
Purchase Details
Closed on
Jan 18, 2011
Sold by
Woods Wayne M and Woods Suzanne W
Bought by
Woods Wayne M and Woods Suzanne W
Purchase Details
Closed on
May 10, 2002
Sold by
Todd Truman J and Todd Kelli D
Bought by
Woods Wayne M and Woods Suzanne W
Purchase Details
Closed on
Jul 27, 1995
Sold by
Noonkester Cathi
Bought by
Todd Truman J and Todd Kelli D
Home Financials for this Owner
Home Financials are based on the most recent Mortgage that was taken out on this home.
Original Mortgage
$32,247
Interest Rate
7.62%
Create a Home Valuation Report for This Property
The Home Valuation Report is an in-depth analysis detailing your home's value as well as a comparison with similar homes in the area
Home Values in the Area
Average Home Value in this Area
Purchase History
| Date | Buyer | Sale Price | Title Company |
|---|---|---|---|
| Makris Dimitrios | -- | First Centennial Title Co | |
| Makris Dimitrios | $102,500 | First Centennial Reno | |
| Makris Dimitrios | -- | First Centennial Reno | |
| Woods Wayne M | -- | None Available | |
| Woods Wayne M | $173,000 | Stewart Title Northern Nevad | |
| Todd Truman J | $32,500 | Western Title Company Inc |
Source: Public Records
Mortgage History
| Date | Status | Borrower | Loan Amount |
|---|---|---|---|
| Previous Owner | Todd Truman J | $32,247 | |
| Closed | Todd Truman J | $18,000 |
Source: Public Records
Tax History Compared to Growth
Tax History
| Year | Tax Paid | Tax Assessment Tax Assessment Total Assessment is a certain percentage of the fair market value that is determined by local assessors to be the total taxable value of land and additions on the property. | Land | Improvement |
|---|---|---|---|---|
| 2025 | $1,766 | $73,794 | $39,795 | $33,999 |
| 2024 | $1,766 | $72,288 | $37,485 | $34,803 |
| 2023 | $1,721 | $72,670 | $39,200 | $33,470 |
| 2022 | $1,597 | $59,826 | $31,500 | $28,326 |
| 2021 | $1,549 | $49,814 | $21,245 | $28,569 |
| 2020 | $1,500 | $49,000 | $19,985 | $29,015 |
| 2019 | $1,455 | $48,637 | $20,300 | $28,337 |
| 2018 | $1,419 | $41,853 | $14,455 | $27,398 |
| 2017 | $1,362 | $40,656 | $12,915 | $27,741 |
| 2016 | $1,328 | $39,974 | $11,340 | $28,634 |
| 2015 | $1,328 | $38,521 | $9,625 | $28,896 |
| 2014 | $1,288 | $36,455 | $8,575 | $27,880 |
| 2013 | -- | $33,942 | $6,125 | $27,817 |
Source: Public Records
Map
Nearby Homes
- 2718 Powder Dr
- 3055 Slater Ct
- 730 James Ct
- 2595 W 7th St
- 1230 Freddie Ct
- 1169 Wagon Wheel Cir
- 610 Akard Cir
- 670 Nancy Cir
- 1350 Marne Dr
- 1270 Searchlite Ct
- 1455 Exeter Way
- 1265 Searchlite Ct
- 2260 W 6th St
- 3570 W 7th St
- 880 Ruby Ave
- 3465 Yosemite Place
- 2100 W 6th St
- 3887 Allen Glen Dr
- 1200 Wild Oak Ct
- 1970 W 6th St
- 1065 Braddock Ct
- 1095 Braddock Ct
- 1070 Hartford Ct
- 1045 Braddock Ct
- 1025 Braddock Ct
- 1005 Braddock Ct
- 1050 Braddock Ct
- 1045 Hartford Ct
- 1070 Braddock Ct
- 1030 Braddock Ct
- 1015 Hartford Ct
- 1025 Hartford Ct
- 1095 Hartford Ct
- 1085 Hartford Ct
- 1065 Hartford Ct
- 1010 Braddock Ct
- 2706 Powder Dr
- 2712 Powder Dr
- 2654 Rayma Ct