1075 Guillebeau Rd Lincolnton, GA 30817
Estimated Value: $346,000 - $510,225
4
Beds
2
Baths
1,792
Sq Ft
$253/Sq Ft
Est. Value
About This Home
This home is located at 1075 Guillebeau Rd, Lincolnton, GA 30817 and is currently estimated at $454,056, approximately $253 per square foot. 1075 Guillebeau Rd is a home located in Lincoln County with nearby schools including Lincoln County Elementary School, Lincoln County Middle School, and Lincoln County High School.
Ownership History
Date
Name
Owned For
Owner Type
Purchase Details
Closed on
Mar 8, 2011
Sold by
Bartles Phil W and Estate Of Harry H Bartles
Bought by
Bartles Phil W and Will Of Harry H Bartles
Current Estimated Value
Purchase Details
Closed on
Apr 20, 2005
Sold by
Bartles Harry H
Bought by
Plagwitz Billy G and Plagwitz Margaret P
Purchase Details
Closed on
Jul 5, 2001
Sold by
Bartles Phil W
Bought by
Bartles Harry H
Purchase Details
Closed on
Feb 15, 2001
Sold by
Bartles Harry H
Bought by
Bartless Phil W
Purchase Details
Closed on
Oct 5, 1998
Sold by
Bartles Phil W
Bought by
Bartles Harry H
Purchase Details
Closed on
Feb 19, 1998
Sold by
Levertte Mary Frances
Bought by
Bartles Phil W and Bartles Harry
Create a Home Valuation Report for This Property
The Home Valuation Report is an in-depth analysis detailing your home's value as well as a comparison with similar homes in the area
Home Values in the Area
Average Home Value in this Area
Purchase History
| Date | Buyer | Sale Price | Title Company |
|---|---|---|---|
| Bartles Phil W | -- | -- | |
| Plagwitz Billy G | $89,250 | -- | |
| Bartles Harry H | $50,000 | -- | |
| Bartless Phil W | $65,000 | -- | |
| Bartles Harry H | $30,000 | -- | |
| Bartles Phil W | $27,500 | -- |
Source: Public Records
Tax History Compared to Growth
Tax History
| Year | Tax Paid | Tax Assessment Tax Assessment Total Assessment is a certain percentage of the fair market value that is determined by local assessors to be the total taxable value of land and additions on the property. | Land | Improvement |
|---|---|---|---|---|
| 2024 | $3,576 | $158,840 | $39,520 | $119,320 |
| 2023 | $3,705 | $140,880 | $36,720 | $104,160 |
| 2022 | $2,905 | $136,880 | $36,720 | $100,160 |
| 2021 | $2,907 | $122,560 | $31,960 | $90,600 |
| 2020 | $2,822 | $106,160 | $31,960 | $74,200 |
| 2019 | $2,828 | $106,160 | $31,960 | $74,200 |
| 2018 | $3,428 | $109,080 | $31,960 | $77,120 |
| 2017 | $2,863 | $91,080 | $24,400 | $66,680 |
| 2016 | $2,426 | $69,200 | $2,520 | $66,680 |
| 2015 | -- | $91,080 | $24,400 | $66,680 |
| 2014 | -- | $91,080 | $24,400 | $66,680 |
| 2013 | -- | $91,080 | $24,400 | $66,680 |
Source: Public Records
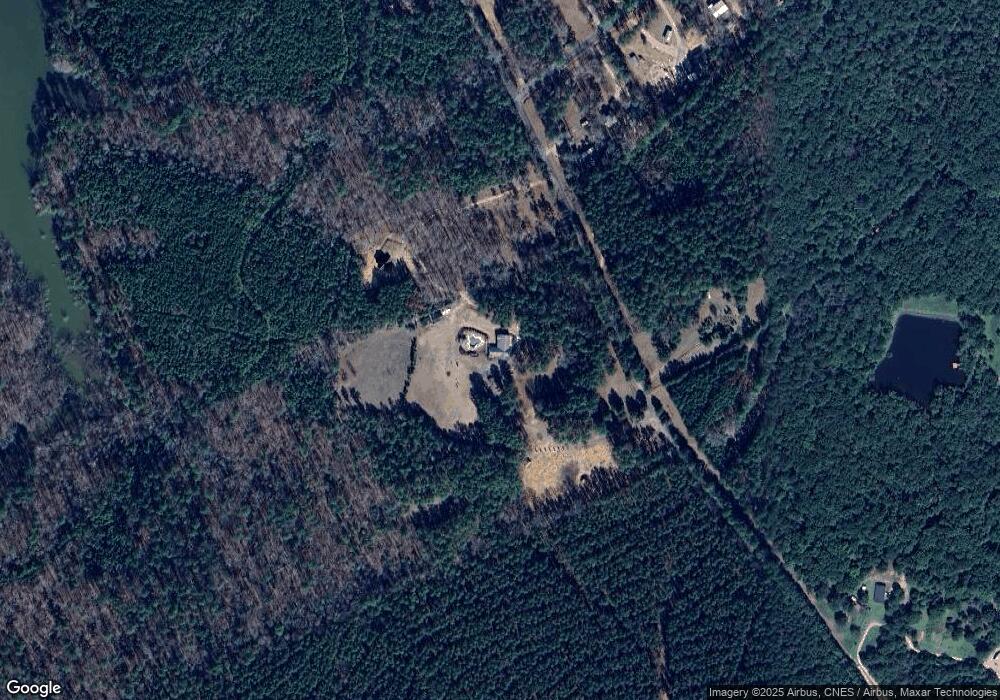
Map
Nearby Homes
- 1051 Lake Dr
- 1085 Lake Dr
- 1036 Longleaf Way
- 1060 Longleaf Way
- 1094 Longleaf Way
- 1106 Longleaf Way
- 1179 Lakeside Dr
- 1129 Lakeside Dr
- 13 Riverview Ct
- 12 Riverview Ct
- 1016 Hidden Lake Ct
- 00 Chamberlain S Ferry Rd
- 1032 Serenity Pointe Dr
- 1131 Whitstone Rd
- 1128 Whitstone Rd
- 1018 Serenity Pointe Dr
- 1008 Serenity Pointe Dr
- 1080 Serenity Pointe Dr
- 1158 Sally Ann Ct
- 1164 Sally Ann Ct