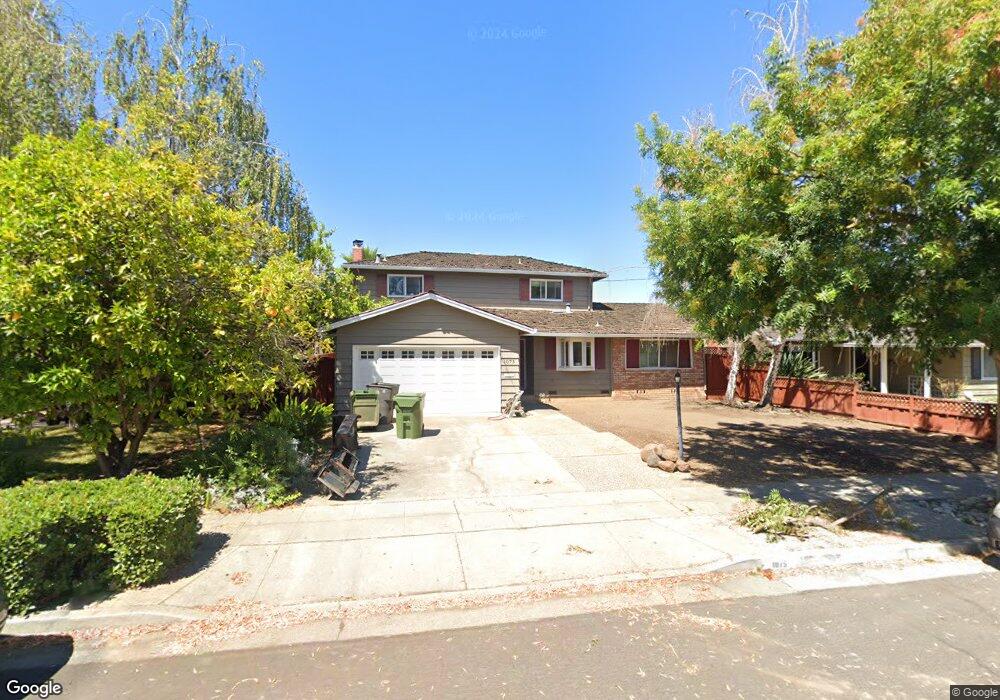
1075 Mitchell Ct San Jose, CA 95128
Castlemont NeighborhoodEstimated Value: $1,720,000 - $2,042,000
4
Beds
2
Baths
1,690
Sq Ft
$1,080/Sq Ft
Est. Value
About This Home
This home is located at 1075 Mitchell Ct, San Jose, CA 95128 and is currently estimated at $1,824,604, approximately $1,079 per square foot. 1075 Mitchell Ct is a home located in Santa Clara County with nearby schools including Del Mar High School, Monroe Middle School, and Castlemont Elementary School.
Ownership History
Date
Name
Owned For
Owner Type
Purchase Details
Closed on
Feb 25, 2008
Sold by
Baca Thomas M
Bought by
Baca Thomas M
Current Estimated Value
Home Financials for this Owner
Home Financials are based on the most recent Mortgage that was taken out on this home.
Original Mortgage
$65,800
Outstanding Balance
$29,134
Interest Rate
5.41%
Mortgage Type
Credit Line Revolving
Estimated Equity
$1,795,470
Purchase Details
Closed on
Jan 22, 2007
Sold by
Baca Thomas M and Durant Baca Michele A
Bought by
Baca Thomas M
Home Financials for this Owner
Home Financials are based on the most recent Mortgage that was taken out on this home.
Original Mortgage
$643,000
Interest Rate
1%
Mortgage Type
New Conventional
Purchase Details
Closed on
Jul 20, 2000
Sold by
Fettgather Robert P
Bought by
Baca Thomas M and Durant Baca Michele A
Home Financials for this Owner
Home Financials are based on the most recent Mortgage that was taken out on this home.
Original Mortgage
$225,000
Interest Rate
8.12%
Purchase Details
Closed on
May 23, 1995
Sold by
Fettgather June M
Bought by
Fettgather June M
Purchase Details
Closed on
Apr 5, 1995
Sold by
Fettgather June M
Bought by
Fettgather June M
Create a Home Valuation Report for This Property
The Home Valuation Report is an in-depth analysis detailing your home's value as well as a comparison with similar homes in the area
Home Values in the Area
Average Home Value in this Area
Purchase History
| Date | Buyer | Sale Price | Title Company |
|---|---|---|---|
| Baca Thomas M | -- | Multiple | |
| Baca Thomas M | -- | Old Republic Title Company | |
| Baca Thomas M | $500,000 | Old Republic Title Company | |
| Fettgather June M | -- | -- | |
| Fettgather June M | -- | -- |
Source: Public Records
Mortgage History
| Date | Status | Borrower | Loan Amount |
|---|---|---|---|
| Open | Baca Thomas M | $65,800 | |
| Open | Baca Thomas M | $607,500 | |
| Closed | Baca Thomas M | $643,000 | |
| Closed | Baca Thomas M | $225,000 |
Source: Public Records
Tax History
| Year | Tax Paid | Tax Assessment Tax Assessment Total Assessment is a certain percentage of the fair market value that is determined by local assessors to be the total taxable value of land and additions on the property. | Land | Improvement |
|---|---|---|---|---|
| 2025 | $9,825 | $753,401 | $226,015 | $527,386 |
| 2024 | $9,825 | $738,630 | $221,584 | $517,046 |
| 2023 | $9,692 | $724,148 | $217,240 | $506,908 |
| 2022 | $9,658 | $709,950 | $212,981 | $496,969 |
| 2021 | $9,476 | $696,030 | $208,805 | $487,225 |
| 2020 | $9,225 | $688,894 | $206,664 | $482,230 |
| 2019 | $9,089 | $675,387 | $202,612 | $472,775 |
| 2018 | $8,804 | $662,145 | $198,640 | $463,505 |
| 2017 | $8,672 | $649,163 | $194,746 | $454,417 |
| 2016 | $8,153 | $636,435 | $190,928 | $445,507 |
| 2015 | $8,007 | $626,877 | $188,061 | $438,816 |
| 2014 | $7,708 | $614,599 | $184,378 | $430,221 |
Source: Public Records
Map
Nearby Homes
- 1259 N Central Ave
- 1149 S Daniel Way
- 2570 Downing Ave
- 919 Ravenscourt Ave
- 991 Wainwright Dr
- 1460 Regalo Ct
- 160 Quail Hollow Dr Unit 160A
- 102 Quail Hollow Dr Unit 102
- 1023 Delna Manor Ln Unit Lane
- 3028 Neal Ave
- 3230 Verdant Way
- 2241 Lindaire Ave
- 2253 Maywood Ave
- 331 N 1st St Unit 3
- 880 Catkin Ct
- 801 S Winchester Blvd Unit 4116
- 801 S Winchester Blvd Unit 5101
- 801 S Winchester Blvd Unit 2401
- 801 S Winchester Blvd Unit 3206
- 1412 Antonio Ln
- 1065 Mitchell Ct
- 1085 Mitchell Ct
- 1084 N Central Ave
- 1096 N Central Ave
- 1055 Mitchell Ct
- 1072 N Central Ave
- 1095 Mitchell Ct
- 1090 Mitchell Ct
- 1106 N Central Ave
- 1080 Mitchell Ct
- 1090 Mitchell Ct
- 1066 Mitchell Ct
- 1056 N Central Ave
- 1056 N Central Ave
- 1045 Mitchell Ct
- 1100 Mitchell Ct
- 1044 N Central Ave
- 1044 Mitchell Ct
- 1079 Almarida Dr
- 1079 N Central Ave
Your Personal Tour Guide
Ask me questions while you tour the home.