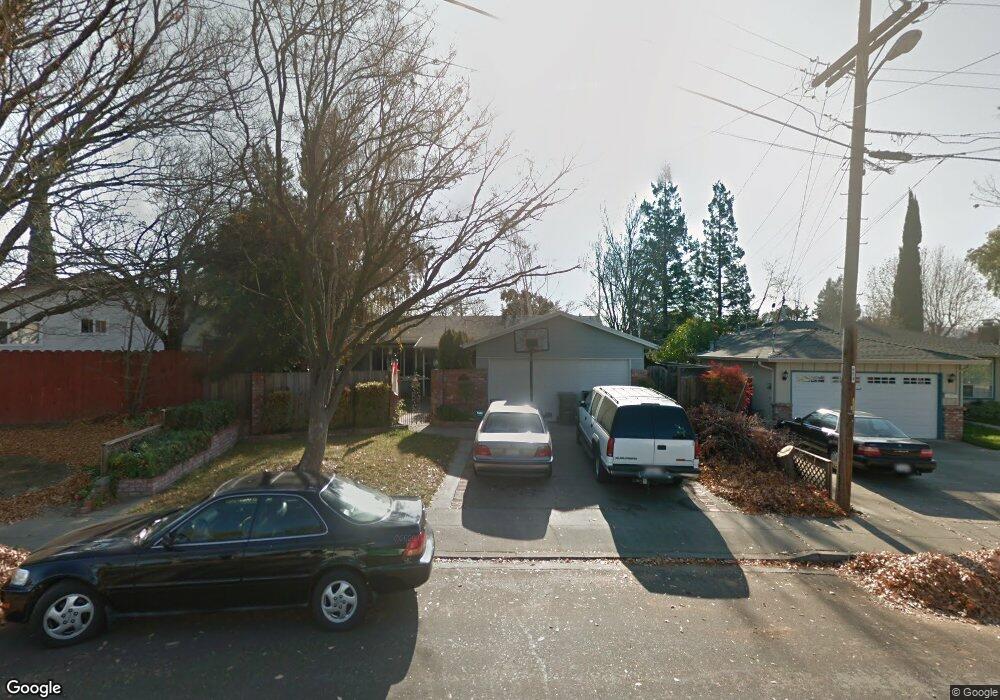
1075 Redondo Way Livermore, CA 94550
Sunset West NeighborhoodEstimated Value: $1,099,000 - $1,186,555
4
Beds
2
Baths
1,654
Sq Ft
$689/Sq Ft
Est. Value
About This Home
This home is located at 1075 Redondo Way, Livermore, CA 94550 and is currently estimated at $1,139,639, approximately $689 per square foot. 1075 Redondo Way is a home located in Alameda County with nearby schools including Joe Michell K-8 School, Granada High School, and St Michael's School.
Ownership History
Date
Name
Owned For
Owner Type
Purchase Details
Closed on
Sep 12, 2001
Sold by
Bjeletich Marko J and Bjeletich Elissa D
Bought by
Fitzgerald Scott M and Fitzgerald Melissa J
Current Estimated Value
Home Financials for this Owner
Home Financials are based on the most recent Mortgage that was taken out on this home.
Original Mortgage
$275,000
Outstanding Balance
$107,313
Interest Rate
7%
Estimated Equity
$1,032,326
Purchase Details
Closed on
Aug 30, 1999
Sold by
Powell James F and Powell Cheri R
Bought by
Bjeletich Marko J and Bjeletich Elissa D
Home Financials for this Owner
Home Financials are based on the most recent Mortgage that was taken out on this home.
Original Mortgage
$240,000
Interest Rate
7.5%
Create a Home Valuation Report for This Property
The Home Valuation Report is an in-depth analysis detailing your home's value as well as a comparison with similar homes in the area
Home Values in the Area
Average Home Value in this Area
Purchase History
| Date | Buyer | Sale Price | Title Company |
|---|---|---|---|
| Fitzgerald Scott M | $410,000 | Old Republic Title Company | |
| Bjeletich Marko J | $300,000 | North American Title Co |
Source: Public Records
Mortgage History
| Date | Status | Borrower | Loan Amount |
|---|---|---|---|
| Open | Fitzgerald Scott M | $275,000 | |
| Previous Owner | Bjeletich Marko J | $240,000 | |
| Closed | Fitzgerald Scott M | $135,000 |
Source: Public Records
Tax History Compared to Growth
Tax History
| Year | Tax Paid | Tax Assessment Tax Assessment Total Assessment is a certain percentage of the fair market value that is determined by local assessors to be the total taxable value of land and additions on the property. | Land | Improvement |
|---|---|---|---|---|
| 2025 | $7,807 | $598,651 | $181,695 | $423,956 |
| 2024 | $7,807 | $586,777 | $178,133 | $415,644 |
| 2023 | $7,686 | $582,137 | $174,641 | $407,496 |
| 2022 | $7,572 | $563,723 | $171,217 | $399,506 |
| 2021 | $6,673 | $552,534 | $167,860 | $391,674 |
| 2020 | $7,197 | $553,798 | $166,139 | $387,659 |
| 2019 | $7,224 | $542,941 | $162,882 | $380,059 |
| 2018 | $7,066 | $532,298 | $159,689 | $372,609 |
| 2017 | $6,883 | $521,864 | $156,559 | $365,305 |
| 2016 | $6,626 | $511,634 | $153,490 | $358,144 |
| 2015 | $6,218 | $503,951 | $151,185 | $352,766 |
| 2014 | $6,109 | $494,081 | $148,224 | $345,857 |
Source: Public Records
Map
Nearby Homes
- 967 Miranda Way
- 958 El Caminito
- 1247 Columbus Ave
- 1734 Catalina Ct
- 1467 Hudson Way
- 822 Cortez Ct
- 1348 Carlton Place
- 791 Via Del Sol
- 1110 Lomitas Ave
- 831 Wagoner Dr
- 851 Carmel Ave
- 765 Moraga Dr
- 2157 Farmington Place
- 578 Escondido Cir
- 1087 Murrieta Blvd Unit 242
- 1087 Murrieta Blvd Unit 245
- 1087 Murrieta Blvd Unit 138
- 1087 Murrieta Blvd Unit 233
- 1001 Murrieta Blvd Unit 4
- 1001 Murrieta Blvd Unit 114
- 1063 Redondo Way
- 1343 El Dorado Dr
- 1094 Madrone Way
- 1112 Madrone Way
- 1355 El Dorado Dr
- 1051 Redondo Way
- 1082 Madrone Way
- 1068 Redondo Way
- 1124 Madrone Way
- 1367 El Dorado Dr
- 1039 Redondo Way
- 1070 Madrone Way
- 1056 Redondo Way
- 1342 El Dorado Dr
- 1319 El Dorado Dr
- 1150 Sierra Ct
- 1136 Madrone Way
- 1330 El Dorado Dr
- 1044 Redondo Way
- 1379 El Dorado Dr