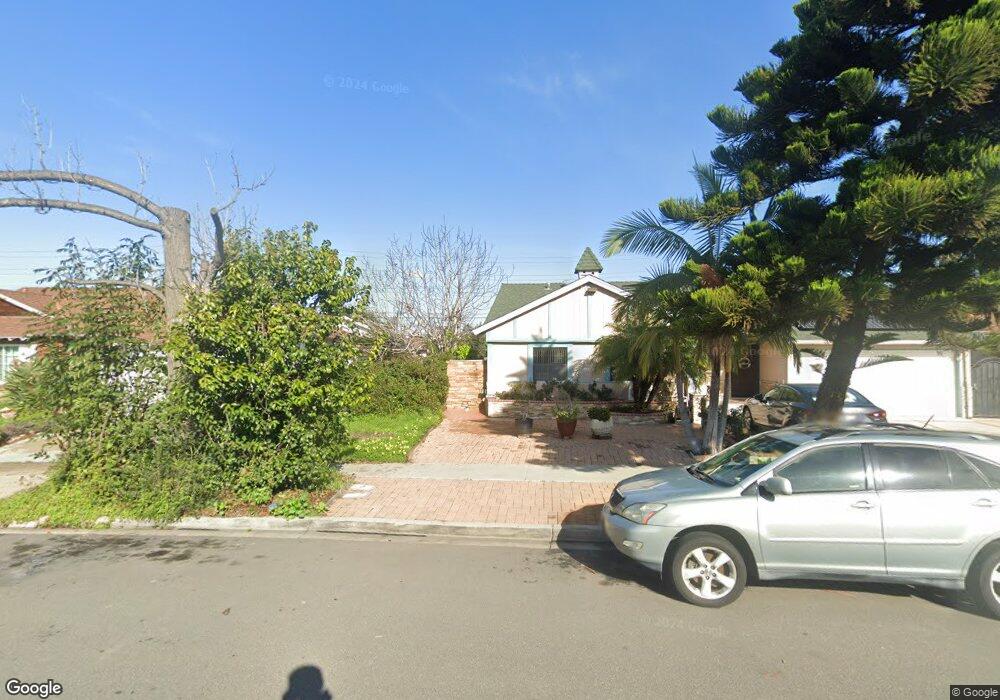
10755 Magnolia Ave Unit 104 Anaheim, CA 92804
West Anaheim NeighborhoodEstimated Value: $432,000 - $519,000
2
Beds
3
Baths
982
Sq Ft
$490/Sq Ft
Est. Value
About This Home
This home is located at 10755 Magnolia Ave Unit 104, Anaheim, CA 92804 and is currently estimated at $480,892, approximately $489 per square foot. 10755 Magnolia Ave Unit 104 is a home located in Orange County with nearby schools including Esther L. Walter Elementary School, Dale Jr High School, and Magnolia High.
Ownership History
Date
Name
Owned For
Owner Type
Purchase Details
Closed on
Sep 9, 2019
Sold by
Perrine Josefina M
Bought by
Perrine Josefina M and Josefina M Perrine Rlt
Current Estimated Value
Purchase Details
Closed on
May 4, 2004
Sold by
Dimas John S
Bought by
Dimas Karen L
Home Financials for this Owner
Home Financials are based on the most recent Mortgage that was taken out on this home.
Original Mortgage
$195,900
Outstanding Balance
$91,158
Interest Rate
5.5%
Mortgage Type
FHA
Estimated Equity
$389,734
Purchase Details
Closed on
Apr 23, 2004
Sold by
Dimas Karen L and Dimas Karen L Gonzales
Bought by
Perrine Gordon D and Perrine Josefina M
Home Financials for this Owner
Home Financials are based on the most recent Mortgage that was taken out on this home.
Original Mortgage
$195,900
Outstanding Balance
$91,158
Interest Rate
5.5%
Mortgage Type
FHA
Estimated Equity
$389,734
Create a Home Valuation Report for This Property
The Home Valuation Report is an in-depth analysis detailing your home's value as well as a comparison with similar homes in the area
Home Values in the Area
Average Home Value in this Area
Purchase History
| Date | Buyer | Sale Price | Title Company |
|---|---|---|---|
| Perrine Josefina M | -- | None Available | |
| Dimas Karen L | -- | First American Title Company | |
| Perrine Gordon D | $202,000 | First American Title Company | |
| Dimas Karen L Gonzales | -- | First American Title Company |
Source: Public Records
Mortgage History
| Date | Status | Borrower | Loan Amount |
|---|---|---|---|
| Open | Perrine Gordon D | $195,900 |
Source: Public Records
Tax History Compared to Growth
Tax History
| Year | Tax Paid | Tax Assessment Tax Assessment Total Assessment is a certain percentage of the fair market value that is determined by local assessors to be the total taxable value of land and additions on the property. | Land | Improvement |
|---|---|---|---|---|
| 2025 | $3,801 | $319,891 | $247,502 | $72,389 |
| 2024 | $3,801 | $313,619 | $242,649 | $70,970 |
| 2023 | $3,703 | $307,470 | $237,891 | $69,579 |
| 2022 | $3,664 | $301,442 | $233,227 | $68,215 |
| 2021 | $3,621 | $295,532 | $228,654 | $66,878 |
| 2020 | $3,597 | $292,502 | $226,309 | $66,193 |
| 2019 | $3,510 | $286,767 | $221,871 | $64,896 |
| 2018 | $3,466 | $281,145 | $217,521 | $63,624 |
| 2017 | $3,346 | $275,633 | $213,256 | $62,377 |
| 2016 | $3,062 | $246,000 | $190,881 | $55,119 |
| 2015 | $3,072 | $246,000 | $190,881 | $55,119 |
| 2014 | $2,231 | $176,250 | $121,131 | $55,119 |
Source: Public Records
Map
Nearby Homes
- 9041 Stacie Ln Unit 12
- 90093 Stacie Ln
- 9155 Pacific Ave Unit 265
- 2631 W Cerritos Ave
- 8952 Poinsettia Ln
- 8681 Katella Ave
- 8681 Katella Ave Unit 914
- 8681 Katella Ave Unit 861
- 10800 Dale Ave Unit 129
- 10800 Dale Ave Unit 705
- 9272 Cerritos Ave
- 11172 Homeway Dr
- 11222 Magnolia St
- 2533 W Chanticleer Rd
- 8532 Adah St
- 8921 Kennelly Ln
- 11251 Bowles Ave
- 10211 Macduff St
- 9592 Katella Ave
- 9262 Joyzelle Dr
- 10749 Magnolia Ave Unit 103
- 10749 Magnolia Ave Unit 101
- 10749 Magnolia Ave Unit 104
- 10749 Magnolia Ave Unit 102
- 10751 Magnolia Ave
- 10751 Magnolia Ave Unit 104
- 10751 Magnolia Ave Unit 101
- 10751 Magnolia Ave Unit 103
- 10751 Magnolia Ave Unit 102
- 10755 Magnolia Ave Unit 102
- 10755 Magnolia Ave
- 10755 Magnolia Ave Unit 103
- 10755 Magnolia Ave Unit 101
- 10757 Magnolia Ave
- 10757 Magnolia Ave Unit 103
- 10757 Magnolia Ave Unit 104
- 10757 Magnolia Ave Unit 101
- 10759 Magnolia Ave Unit 104
- 10759 Magnolia Ave Unit 101
- 10759 Magnolia Ave Unit 102