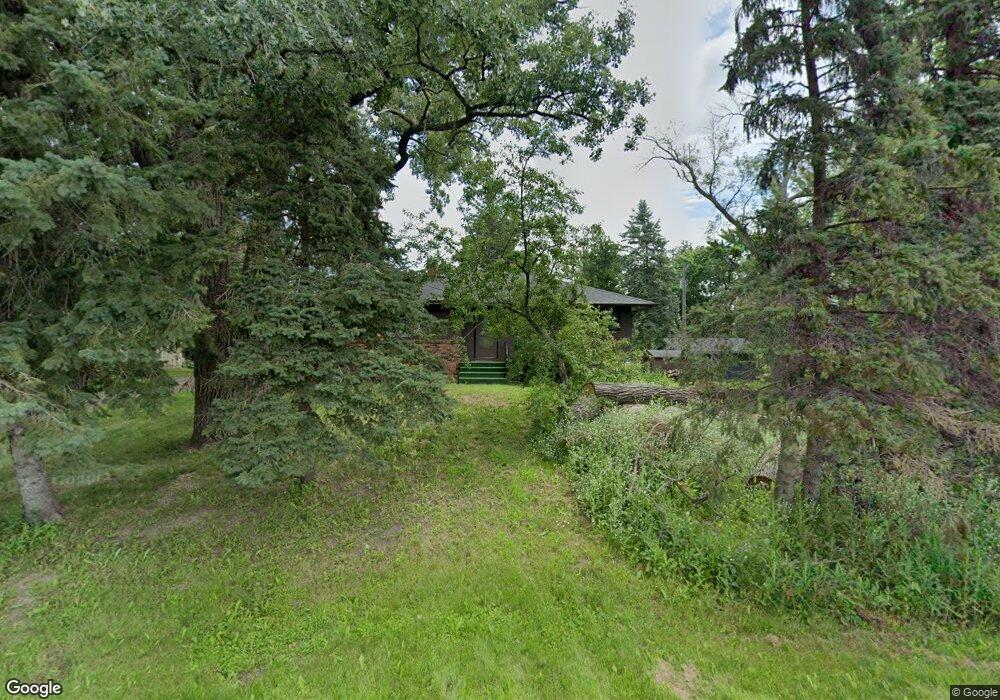
10756 Holly Ln N Maple Grove, MN 55369
Estimated Value: $366,000 - $445,000
3
Beds
2
Baths
2,256
Sq Ft
$172/Sq Ft
Est. Value
About This Home
This home is located at 10756 Holly Ln N, Maple Grove, MN 55369 and is currently estimated at $387,743, approximately $171 per square foot. 10756 Holly Ln N is a home located in Hennepin County with nearby schools including Fernbrook Elementary School, Osseo Middle School, and Maple Grove Senior High School.
Ownership History
Date
Name
Owned For
Owner Type
Purchase Details
Closed on
Apr 9, 2021
Sold by
Johnson Kurt David and Johnson Julia Kate
Bought by
Wolf Samantha and Wolf Ashley
Current Estimated Value
Home Financials for this Owner
Home Financials are based on the most recent Mortgage that was taken out on this home.
Original Mortgage
$299,250
Outstanding Balance
$270,403
Interest Rate
3.05%
Mortgage Type
New Conventional
Estimated Equity
$117,340
Purchase Details
Closed on
Oct 16, 2017
Sold by
Christensen Leroy P
Bought by
Johnson Kurt David and Johnson Julia Kate
Home Financials for this Owner
Home Financials are based on the most recent Mortgage that was taken out on this home.
Original Mortgage
$184,320
Interest Rate
3.78%
Mortgage Type
VA
Create a Home Valuation Report for This Property
The Home Valuation Report is an in-depth analysis detailing your home's value as well as a comparison with similar homes in the area
Home Values in the Area
Average Home Value in this Area
Purchase History
| Date | Buyer | Sale Price | Title Company |
|---|---|---|---|
| Wolf Samantha | $315,000 | Home Security Abstract & Ttl | |
| Johnson Kurt David | $180,000 | Home Security Abstract & Tit | |
| Christensen Elaine M | -- | None Available |
Source: Public Records
Mortgage History
| Date | Status | Borrower | Loan Amount |
|---|---|---|---|
| Open | Wolf Samantha | $299,250 | |
| Previous Owner | Johnson Kurt David | $184,320 |
Source: Public Records
Tax History Compared to Growth
Tax History
| Year | Tax Paid | Tax Assessment Tax Assessment Total Assessment is a certain percentage of the fair market value that is determined by local assessors to be the total taxable value of land and additions on the property. | Land | Improvement |
|---|---|---|---|---|
| 2024 | $3,451 | $299,500 | $72,000 | $227,500 |
| 2023 | $3,477 | $304,200 | $72,000 | $232,200 |
| 2022 | $2,492 | $313,800 | $72,000 | $241,800 |
| 2021 | $2,498 | $219,700 | $45,000 | $174,700 |
| 2020 | $2,525 | $216,800 | $45,000 | $171,800 |
| 2019 | $2,614 | $209,000 | $46,000 | $163,000 |
| 2018 | $2,405 | $199,800 | $45,000 | $154,800 |
| 2017 | $2,286 | $173,600 | $45,000 | $128,600 |
| 2016 | $2,283 | $171,400 | $45,000 | $126,400 |
| 2015 | $2,460 | $178,200 | $53,600 | $124,600 |
| 2014 | -- | $168,700 | $50,400 | $118,300 |
Source: Public Records
Map
Nearby Homes
- 16755 106th Place N
- 10888 Territorial Trail
- 10892 Territorial Trail
- 16400 County Road 81
- 10352 Peony Ln N
- 10361 Peony Ln N
- 10334 Peony Ln N
- 10388 Peony Ln N
- 10382 Peony Ln N
- 10364 Peony Ln N
- 10324 Peony Ln N
- 10317 Peony Ln N
- 18255 104th Cir N
- Fremont Plan at The Reserve at Elm Creek - West Collection
- Harriet Plan at The Reserve at Elm Creek - West Collection
- Pepin Plan at The Reserve at Elm Creek - West Collection
- Mississippi Plan at The Reserve at Elm Creek - West Collection
- Vermillion Plan at The Reserve at Elm Creek - West Collection
- Nokomis Plan at The Reserve at Elm Creek - West Collection
- St. Croix Plan at The Reserve at Elm Creek - West Collection
- 10768 Holly Ln N
- 10757 Garland Ln N
- 10773 Garland Ln N
- 10600 Holly Ln N
- 10530 Holly Ln N
- 16930 106th Place N
- 10520 Holly Ln N
- 16855 106th Place N
- 10747 Dunkirk Ln N
- 10510 Holly Ln N
- 16820 106th Place N
- 10766 Dunkirk Ln N
- 10725 Dunkirk Ln N
- 10701 Dunkirk Ln N
- 16860 Arbor Ridge Pkwy
- 17055 Arbor Ridge Pkwy
- 10750 Dunkirk Ln N
- 16911 Arbor Ridge Pkwy
- 10740 Dunkirk Ln N
- 10710 Dunkirk Ln N