
Seller's Agent in 2026
Brendan Taylor
RE/MAX
(330) 687-0302
5 in this area
85 Total Sales
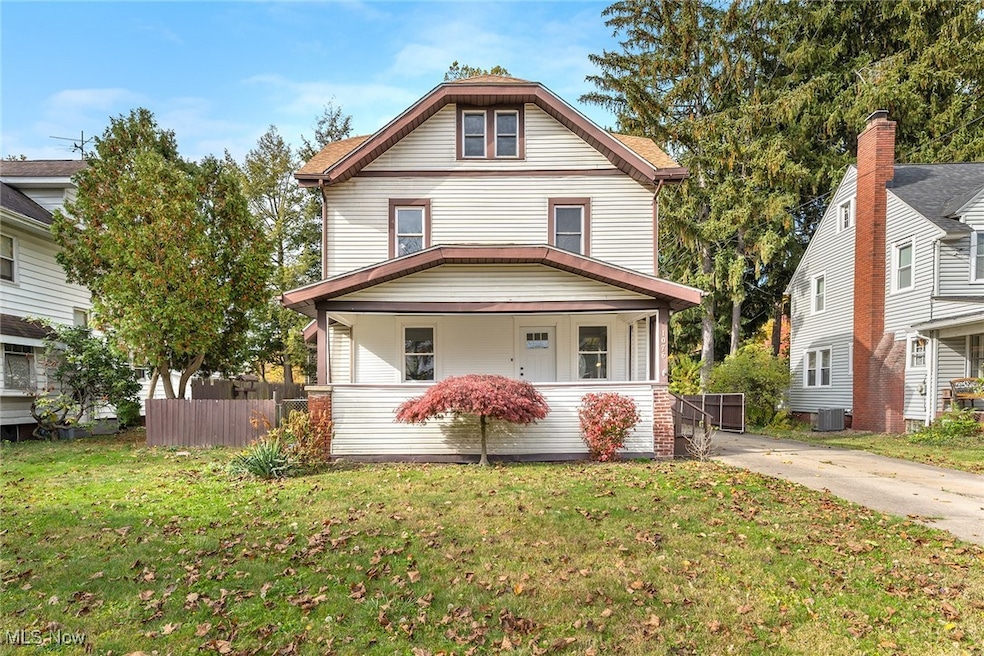
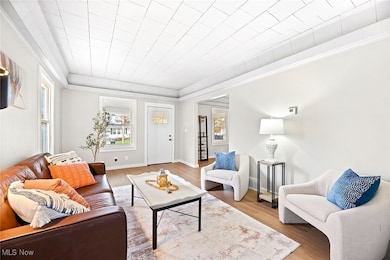
Recently Renovated North Hill Gem!
Welcome home to 1076 Chalker St, a beautifully updated 4-bedroom, 1.5-bath home located on a quiet street in Akron’s desirable North Hill neighborhood. This property has been thoughtfully renovated from top to bottom, featuring a brand-new kitchen with modern cabinetry, countertops, and appliances, plus completely updated bathrooms with stylish finishes.
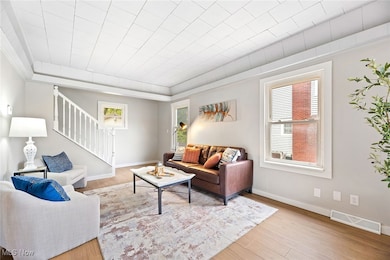
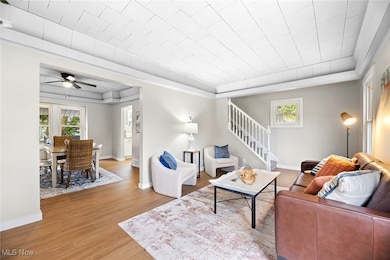
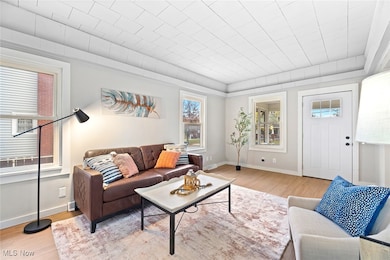
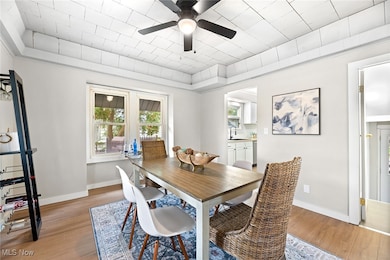
Enjoy peace of mind with new HVAC, new flooring throughout, fresh interior and exterior paint, and new doors inside and out. The home’s layout offers spacious living and dining areas, perfect for entertaining or family living.
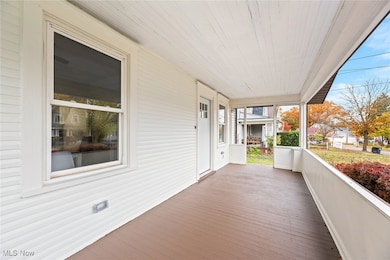
Outside, you’ll find a welcoming yard in a calm residential setting—yet still close to schools, parks, shopping, and major highways for easy commuting.
Move-in ready and full of updates, this North Hill beauty is one you won’t want to miss!
Last Agent to Sell the Property
RE/MAX Trends Realty Brokerage Email: brendan@trendsrealtyofohio.com, 330-687-0302 License #2017003006 Listed on: 11/05/2025
| Date | Type | Sale Price | Title Company |
|---|---|---|---|
| Warranty Deed | $165,000 | Kingdom Title | |
| Warranty Deed | $55,700 | None Listed On Document | |
| Quit Claim Deed | -- | None Listed On Document | |
| Quit Claim Deed | -- | None Listed On Document | |
| Warranty Deed | $88,000 | Midland Commerce Group |
| Date | Status | Loan Amount | Loan Type |
|---|---|---|---|
| Open | $5,775 | New Conventional | |
| Open | $162,011 | FHA | |
| Previous Owner | $114,000 | Construction | |
| Previous Owner | $86,615 | FHA |
| Date | Event | Price | List to Sale | Price per Sq Ft |
|---|---|---|---|---|
| 01/09/2026 01/09/26 | Sold | $165,000 | -2.9% | $116 / Sq Ft |
| 12/07/2025 12/07/25 | Pending | -- | -- | -- |
| 12/03/2025 12/03/25 | Price Changed | $169,900 | -2.9% | $119 / Sq Ft |
| 11/05/2025 11/05/25 | For Sale | $174,900 | -- | $123 / Sq Ft |
| Year | Tax Paid | Tax Assessment Tax Assessment Total Assessment is a certain percentage of the fair market value that is determined by local assessors to be the total taxable value of land and additions on the property. | Land | Improvement |
|---|---|---|---|---|
| 2025 | $1,875 | $32,995 | $6,895 | $26,100 |
| 2024 | $1,875 | $32,995 | $6,895 | $26,100 |
| 2023 | $1,875 | $32,995 | $6,895 | $26,100 |
| 2022 | $1,498 | $20,140 | $4,057 | $16,083 |
| 2021 | $1,420 | $20,140 | $4,057 | $16,083 |
| 2020 | $1,400 | $20,140 | $4,060 | $16,080 |
| 2019 | $1,548 | $20,390 | $5,850 | $14,540 |
| 2018 | $1,528 | $20,390 | $5,850 | $14,540 |
| 2017 | $1,551 | $20,390 | $5,850 | $14,540 |
| 2016 | $1,552 | $20,390 | $5,850 | $14,540 |
| 2015 | $1,551 | $20,390 | $5,850 | $14,540 |
| 2014 | $1,539 | $20,390 | $5,850 | $14,540 |
| 2013 | $1,573 | $21,330 | $5,850 | $15,480 |
Seller's Agent in 2026
Brendan Taylor
RE/MAX
(330) 687-0302
5 in this area
85 Total Sales
Buyer's Agent in 2026
Darren Mancuso
EXP Realty, LLC.
(216) 225-9474
1 in this area
385 Total Sales
Buyer Co-Listing Agent in 2026
Alexis Pernice
EXP Realty, LLC.
(330) 718-6952
1 in this area
6 Total Sales
Source: MLS Now
MLS Number: 5169997
APN: 68-09958
Disclaimer: Certain information contained herein is derived from information provided by parties other than Homes.com. All information provided is deemed reliable, but is not guaranteed to be accurate and should be independently verified.
![]() IDX information is provided exclusively for personal, non-commercial use, and may not be used for any purpose other than to identify prospective properties consumers may be interested in purchasing. Information is deemed reliable but not guaranteed.
IDX information is provided exclusively for personal, non-commercial use, and may not be used for any purpose other than to identify prospective properties consumers may be interested in purchasing. Information is deemed reliable but not guaranteed.
Ask me questions while you tour the home.