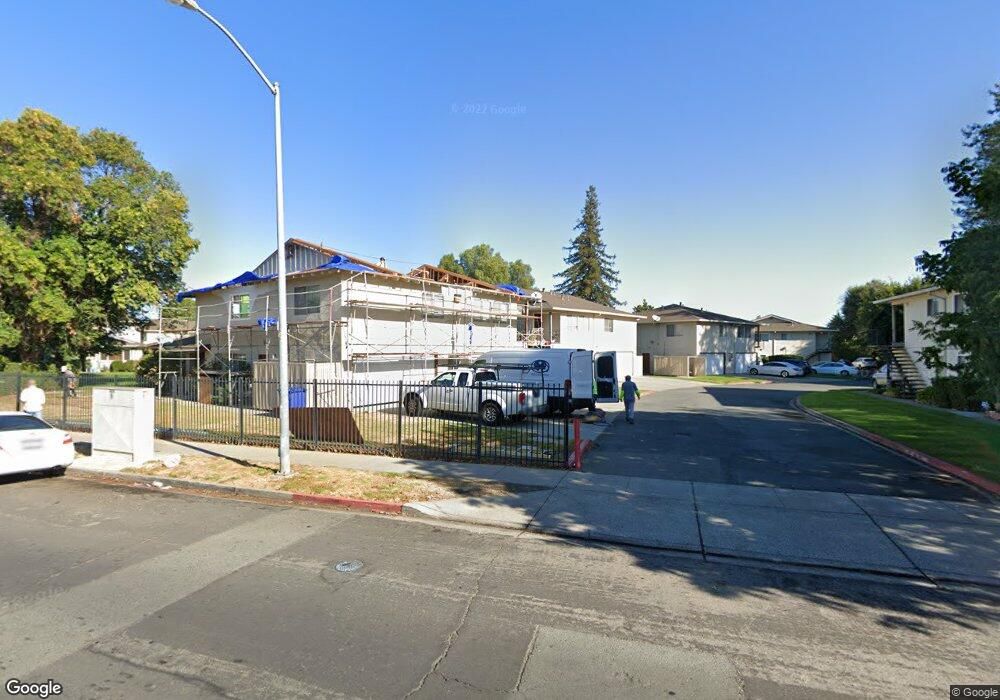
1076 Mohr Ln Unit D Concord, CA 94518
Tree Haven NeighborhoodEstimated Value: $300,000 - $413,000
2
Beds
1
Bath
854
Sq Ft
$392/Sq Ft
Est. Value
About This Home
This home is located at 1076 Mohr Ln Unit D, Concord, CA 94518 and is currently estimated at $335,078, approximately $392 per square foot. 1076 Mohr Ln Unit D is a home located in Contra Costa County with nearby schools including Fair Oaks Elementary School, Oak Grove Middle School, and Ygnacio Valley High School.
Ownership History
Date
Name
Owned For
Owner Type
Purchase Details
Closed on
Jun 8, 2015
Sold by
Lau Tom Chi Shing
Bought by
Guo Zhonghui and Mei Shuqing
Current Estimated Value
Purchase Details
Closed on
Jul 13, 2001
Sold by
Dahler William A
Bought by
Lau Tom Chi Shing
Home Financials for this Owner
Home Financials are based on the most recent Mortgage that was taken out on this home.
Original Mortgage
$110,000
Interest Rate
7.21%
Mortgage Type
Purchase Money Mortgage
Purchase Details
Closed on
Jul 27, 1998
Sold by
Weber Development Inc
Bought by
Dahler William A
Home Financials for this Owner
Home Financials are based on the most recent Mortgage that was taken out on this home.
Original Mortgage
$53,700
Interest Rate
6.9%
Mortgage Type
FHA
Create a Home Valuation Report for This Property
The Home Valuation Report is an in-depth analysis detailing your home's value as well as a comparison with similar homes in the area
Home Values in the Area
Average Home Value in this Area
Purchase History
| Date | Buyer | Sale Price | Title Company |
|---|---|---|---|
| Guo Zhonghui | $220,000 | First American Title Company | |
| Lau Tom Chi Shing | $159,000 | American Title Co | |
| Dahler William A | $54,000 | Placer Title Company |
Source: Public Records
Mortgage History
| Date | Status | Borrower | Loan Amount |
|---|---|---|---|
| Previous Owner | Lau Tom Chi Shing | $110,000 | |
| Previous Owner | Dahler William A | $53,700 |
Source: Public Records
Tax History
| Year | Tax Paid | Tax Assessment Tax Assessment Total Assessment is a certain percentage of the fair market value that is determined by local assessors to be the total taxable value of land and additions on the property. | Land | Improvement |
|---|---|---|---|---|
| 2025 | $3,906 | $264,399 | $120,181 | $144,218 |
| 2024 | $3,705 | $259,216 | $117,825 | $141,391 |
| 2023 | $3,705 | $254,134 | $115,515 | $138,619 |
| 2022 | $3,638 | $249,151 | $113,250 | $135,901 |
| 2021 | $3,534 | $244,267 | $111,030 | $133,237 |
| 2019 | $3,456 | $237,024 | $107,738 | $129,286 |
| 2018 | $3,316 | $232,377 | $105,626 | $126,751 |
| 2017 | $3,193 | $227,821 | $103,555 | $124,266 |
| 2016 | $3,084 | $223,355 | $101,525 | $121,830 |
| 2015 | $2,747 | $195,000 | $61,320 | $133,680 |
| 2014 | $2,297 | $157,500 | $49,528 | $107,972 |
Source: Public Records
Map
Nearby Homes
- 1078 Mohr Ln Unit A
- 1064 Mohr Ln Unit C
- 1369 Del Rio Cir Unit D
- 1369 Del Rio Cir Unit C
- 1387 Del Rio Cir Unit D
- 2050 Monument Blvd
- 1044 Mohr Ln Unit D
- 130 Cleopatra Dr
- 1040 Mohr Ln Unit C
- 1049 Mohr Ln Unit A
- 1459 Del Rio Cir Unit C
- 1360 Del Rio Ct Unit 4
- 1023 Bermuda Dr
- 1045 Mohr Ln Unit B
- 1134 Lovell Ct
- 1013 Mohr Ln Unit 2
- 227 Cleopatra Dr
- 1156 Carey Dr
- 1391 Monument Blvd Unit 20
- 2035 Sherman Dr
- 1076 Mohr Ln Unit C
- 1076 Mohr Ln Unit A
- 1096 Mohr Ln
- 1092 Mohr Ln
- 1096 Mohr Ln Unit A
- 1092 Mohr Ln Unit D
- 1092 Mohr Ln Unit C
- 1092 Mohr Ln Unit B
- 1092 Mohr Ln Unit A
- 1094 Mohr Ln Unit D
- 1094 Mohr Ln Unit C
- 1094 Mohr Ln Unit B
- 1094 Mohr Ln Unit A
- 1096 Mohr Ln Unit D
- 1096 Mohr Ln Unit C
- 1096 Mohr Ln Unit B
- 1078 Mohr Ln Unit D
- 1078 Mohr Ln Unit C
- 1078 Mohr Ln Unit B
- 1080 Mohr Ln Unit D
Your Personal Tour Guide
Ask me questions while you tour the home.