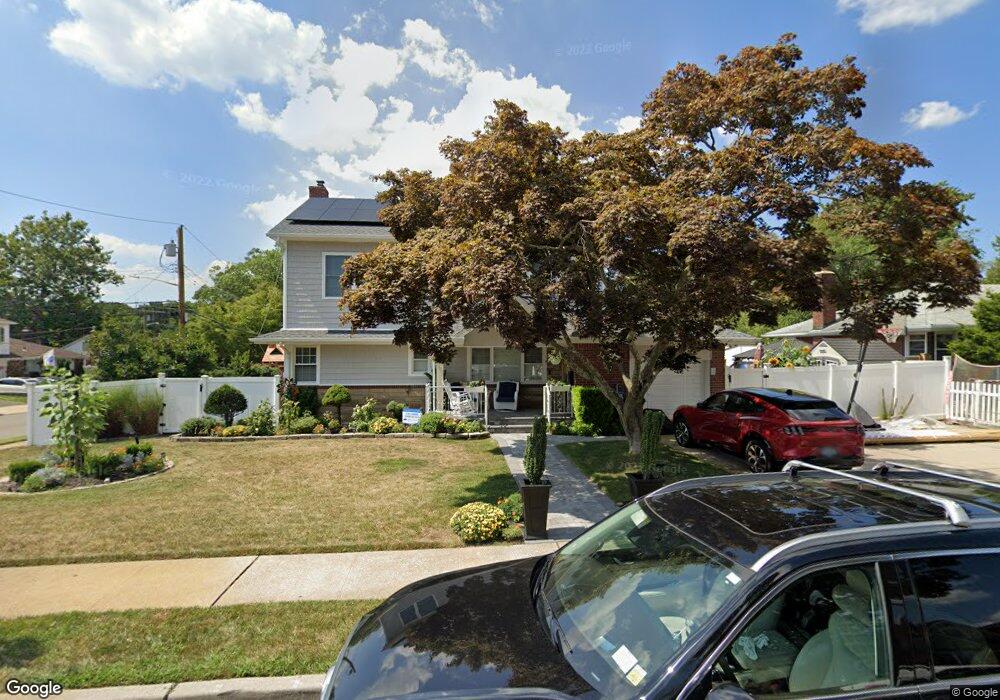
1076 N Grove St Valley Stream, NY 11580
Estimated Value: $777,000 - $812,784
3
Beds
2
Baths
1,065
Sq Ft
$746/Sq Ft
Est. Value
About This Home
This home is located at 1076 N Grove St, Valley Stream, NY 11580 and is currently estimated at $794,892, approximately $746 per square foot. 1076 N Grove St is a home located in Nassau County with nearby schools including Cheder at the Ohel and Valley Stream Christian Academy.
Ownership History
Date
Name
Owned For
Owner Type
Purchase Details
Closed on
Sep 11, 2020
Sold by
Gurdon Stevan Lee and Darch Gretchen
Bought by
Gurdon Stevan Lee and Gurdon Gretchen
Current Estimated Value
Purchase Details
Closed on
Jun 9, 2017
Sold by
Mecca Investors Inc
Bought by
Gurdon Stevan Lee and Darch Gretchen
Home Financials for this Owner
Home Financials are based on the most recent Mortgage that was taken out on this home.
Original Mortgage
$290,000
Outstanding Balance
$241,417
Interest Rate
4.05%
Mortgage Type
New Conventional
Estimated Equity
$553,475
Purchase Details
Closed on
Jan 6, 2017
Sold by
Pollock Robert J and Pollock Mary
Bought by
Mecca Investors Inc
Home Financials for this Owner
Home Financials are based on the most recent Mortgage that was taken out on this home.
Original Mortgage
$248,000
Interest Rate
4.13%
Mortgage Type
Commercial
Create a Home Valuation Report for This Property
The Home Valuation Report is an in-depth analysis detailing your home's value as well as a comparison with similar homes in the area
Home Values in the Area
Average Home Value in this Area
Purchase History
| Date | Buyer | Sale Price | Title Company |
|---|---|---|---|
| Gurdon Stevan Lee | -- | Judicial Title | |
| Gurdon Stevan Lee | $480,000 | Chicago Title Insurance Comp | |
| Mecca Investors Inc | $310,000 | Secured Perimeter Title Agen |
Source: Public Records
Mortgage History
| Date | Status | Borrower | Loan Amount |
|---|---|---|---|
| Open | Gurdon Stevan Lee | $290,000 | |
| Previous Owner | Mecca Investors Inc | $248,000 |
Source: Public Records
Tax History Compared to Growth
Tax History
| Year | Tax Paid | Tax Assessment Tax Assessment Total Assessment is a certain percentage of the fair market value that is determined by local assessors to be the total taxable value of land and additions on the property. | Land | Improvement |
|---|---|---|---|---|
| 2025 | $10,933 | $460 | $235 | $225 |
| 2024 | $3,896 | $483 | $252 | $231 |
| 2023 | $9,607 | $456 | $233 | $223 |
| 2022 | $9,607 | $494 | $252 | $242 |
| 2021 | $10,815 | $473 | $241 | $232 |
| 2020 | $10,815 | $537 | $518 | $19 |
| 2019 | $9,250 | $537 | $518 | $19 |
| 2018 | $9,920 | $537 | $0 | $0 |
| 2017 | $2,380 | $537 | $490 | $47 |
| 2016 | $4,193 | $568 | $466 | $102 |
| 2015 | $1,846 | $600 | $492 | $108 |
| 2014 | $1,846 | $600 | $492 | $108 |
| 2013 | $1,829 | $632 | $518 | $114 |
Source: Public Records
Map
Nearby Homes
- 1082 N Grove St
- 81 Cedarlawn Blvd
- 1030 Franklin Ave Unit 16
- 39 Morris Pkwy
- 100 Morris Pkwy
- 69 Lamberson St
- 1122 Scott Dr
- 165 Wheeler Ave
- 281 Wheeler Ave Unit 7
- 1075 Frances Dr
- 6 Keller St
- 885 Downing Rd
- 487 Emerson Place
- 1037 Chestnut St
- 95 Wheeler Ave
- 27 Victor St
- 2 Sheridan St
- 892 Barry Dr W
- 859 Franklin Ave
- 1031 Jerome Rd
- 1340 Higbie St
- 1064 N Grove St
- 567 N Corona Ave
- 471 N Grove St
- 1352 Higbie St
- 477 N Grove St
- 1341 Higbie St
- 1321 Higbie St
- 1092 N Grove St
- 1351 Higbie St
- 483 N Grove St
- 31 Higbie St
- 457 N Grove St
- 34 Higbie St
- 1345 Thompson St
- 1089 N Corona Ave
- 25 Thompson St
- 38 Higbie St
- 451 N Grove St
- 41 Higbie St