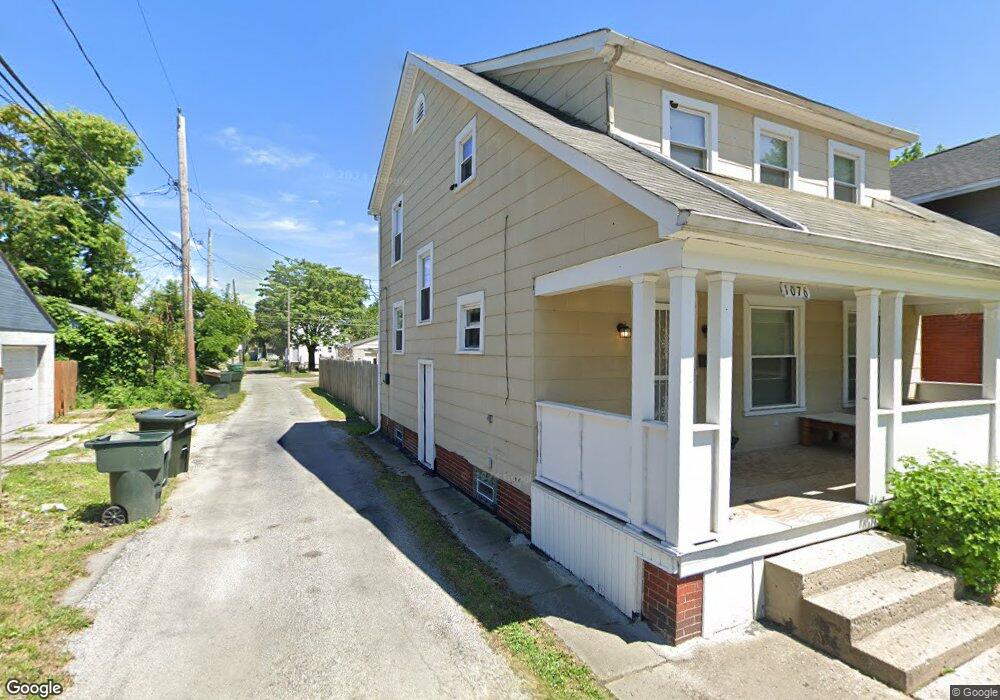
1076 S Ohio Ave Columbus, OH 43206
Karns Park NeighborhoodEstimated Value: $265,000 - $304,000
3
Beds
2
Baths
1,624
Sq Ft
$174/Sq Ft
Est. Value
About This Home
This home is located at 1076 S Ohio Ave, Columbus, OH 43206 and is currently estimated at $283,115, approximately $174 per square foot. 1076 S Ohio Ave is a home located in Franklin County with nearby schools including Livingston Elementary School, South High School, and Capital Collegiate Preparatory Academy.
Ownership History
Date
Name
Owned For
Owner Type
Purchase Details
Closed on
Sep 23, 2022
Sold by
Rankin Alma D
Bought by
Rankin Alma D and Hannah Robert Lee
Current Estimated Value
Home Financials for this Owner
Home Financials are based on the most recent Mortgage that was taken out on this home.
Original Mortgage
$100,000
Outstanding Balance
$95,446
Interest Rate
5.13%
Mortgage Type
New Conventional
Estimated Equity
$187,669
Purchase Details
Closed on
Aug 19, 2009
Sold by
Foraker Marc B and Foraker Lisa
Bought by
Rankin Alma D
Purchase Details
Closed on
Nov 25, 2003
Sold by
Foraker Marc B and Foraker Lisa
Bought by
Foraker Marc B and Foraker Lisa
Home Financials for this Owner
Home Financials are based on the most recent Mortgage that was taken out on this home.
Original Mortgage
$88,200
Interest Rate
8.15%
Mortgage Type
Purchase Money Mortgage
Purchase Details
Closed on
Aug 13, 1991
Bought by
Foraker Marc B
Purchase Details
Closed on
Jan 23, 1990
Create a Home Valuation Report for This Property
The Home Valuation Report is an in-depth analysis detailing your home's value as well as a comparison with similar homes in the area
Home Values in the Area
Average Home Value in this Area
Purchase History
| Date | Buyer | Sale Price | Title Company |
|---|---|---|---|
| Rankin Alma D | $100,000 | Landsel Title Agency | |
| Rankin Alma D | $30,000 | Chicago Tit | |
| Foraker Marc B | -- | -- | |
| Foraker Marc B | -- | -- | |
| -- | $40,000 | -- |
Source: Public Records
Mortgage History
| Date | Status | Borrower | Loan Amount |
|---|---|---|---|
| Open | Rankin Alma D | $100,000 | |
| Previous Owner | Foraker Marc B | $88,200 |
Source: Public Records
Tax History Compared to Growth
Tax History
| Year | Tax Paid | Tax Assessment Tax Assessment Total Assessment is a certain percentage of the fair market value that is determined by local assessors to be the total taxable value of land and additions on the property. | Land | Improvement |
|---|---|---|---|---|
| 2024 | $3,943 | $87,860 | $23,210 | $64,650 |
| 2023 | $3,893 | $87,850 | $23,205 | $64,645 |
| 2022 | $1,888 | $36,400 | $5,600 | $30,800 |
| 2021 | $1,891 | $36,400 | $5,600 | $30,800 |
| 2020 | $1,894 | $36,400 | $5,600 | $30,800 |
| 2019 | $1,746 | $27,590 | $4,310 | $23,280 |
| 2018 | $1,432 | $26,960 | $4,310 | $22,650 |
| 2017 | $1,676 | $26,960 | $4,310 | $22,650 |
| 2016 | $1,269 | $19,150 | $3,960 | $15,190 |
| 2015 | $1,152 | $19,150 | $3,960 | $15,190 |
| 2014 | $1,154 | $19,150 | $3,960 | $15,190 |
| 2013 | $643 | $20,160 | $4,165 | $15,995 |
Source: Public Records
Map
Nearby Homes
- 883 E Whittier St
- 1146 S Champion Ave Unit 1148
- 981 Gilbert St
- 000 Gilbert St
- 00 Gilbert St
- 935 S Ohio Ave
- 931 S Ohio Ave
- 1170 S Champion Ave
- 993 Oakwood Ave
- 943 S Champion Ave
- 918 S Ohio Ave
- 1196 S Ohio Ave
- 975 Carpenter St
- 1191 S 22nd St Unit 1185
- 1064 Heyl Ave
- 1045 Wilson Ave Unit 47
- 887-891 S 22nd St
- 1225-1227 S Champion Ave
- 1100 Wilson Ave Unit 1100
- 867 S 22nd St
- 1080 S Ohio Ave
- 1084 S Ohio Ave Unit 86
- 935 E Whittier St Unit 937
- 931 E Whittier St Unit 933
- 931 E Whittier St Unit 35
- 931-933 E Whittier St
- 941 E Whittier St Unit 943
- 929 E Whittier St
- 941-945 E Whittier St
- 933 E Whittier St
- 1094 S Ohio Ave Unit 96
- 1081 S Champion Ave Unit 83
- 1081-1083 S Champion Ave
- 1087 S Champion Ave Unit 89
- 949 E Whittier St Unit 10
- 949 E Whittier St
- 1091 S Champion Ave
- 1091 S Champion Ave Unit 1091-1093
- 1065 S Ohio Ave Unit 67
- 1098 S Ohio Ave Unit 100