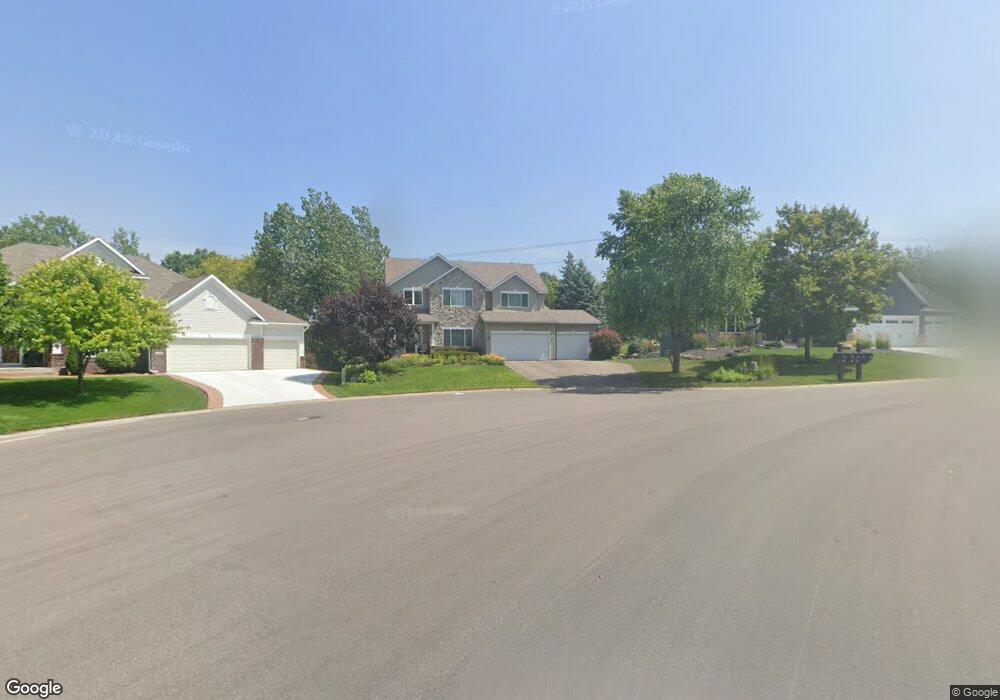
10760 Amherst Way Inver Grove Heights, MN 55077
Estimated Value: $568,693 - $733,000
4
Beds
3
Baths
2,272
Sq Ft
$288/Sq Ft
Est. Value
About This Home
This home is located at 10760 Amherst Way, Inver Grove Heights, MN 55077 and is currently estimated at $653,423, approximately $287 per square foot. 10760 Amherst Way is a home located in Dakota County with nearby schools including Red Pine Elementary School, Rosemount Middle School, and Rosemount Senior High School.
Ownership History
Date
Name
Owned For
Owner Type
Purchase Details
Closed on
Sep 25, 2008
Sold by
Powell Jeffrey L and Powell Kristi K
Bought by
Shaughnessy Michael K and Olson Donna P
Current Estimated Value
Home Financials for this Owner
Home Financials are based on the most recent Mortgage that was taken out on this home.
Original Mortgage
$225,000
Outstanding Balance
$150,265
Interest Rate
6.52%
Mortgage Type
New Conventional
Estimated Equity
$503,158
Purchase Details
Closed on
Aug 23, 2004
Sold by
Wheatcraft Aaron P and Wheatcraft Amy D
Bought by
Powell Jeffrey L and Powell Kristi K
Purchase Details
Closed on
Sep 29, 2000
Sold by
Mw Johnson Construction
Bought by
Wheatcraft Aaron P and Wheatcraft Amy D
Purchase Details
Closed on
Jan 26, 2000
Sold by
Lyman Dev Co
Bought by
M W Johnson Const Inc
Create a Home Valuation Report for This Property
The Home Valuation Report is an in-depth analysis detailing your home's value as well as a comparison with similar homes in the area
Home Values in the Area
Average Home Value in this Area
Purchase History
| Date | Buyer | Sale Price | Title Company |
|---|---|---|---|
| Shaughnessy Michael K | $385,000 | -- | |
| Powell Jeffrey L | $414,000 | -- | |
| Wheatcraft Aaron P | $262,620 | -- | |
| M W Johnson Const Inc | $66,900 | -- |
Source: Public Records
Mortgage History
| Date | Status | Borrower | Loan Amount |
|---|---|---|---|
| Open | Shaughnessy Michael K | $225,000 |
Source: Public Records
Tax History Compared to Growth
Tax History
| Year | Tax Paid | Tax Assessment Tax Assessment Total Assessment is a certain percentage of the fair market value that is determined by local assessors to be the total taxable value of land and additions on the property. | Land | Improvement |
|---|---|---|---|---|
| 2024 | $6,300 | $530,400 | $129,800 | $400,600 |
| 2023 | $6,300 | $502,800 | $126,500 | $376,300 |
| 2022 | $5,570 | $482,200 | $126,400 | $355,800 |
| 2021 | $5,532 | $434,300 | $109,900 | $324,400 |
| 2020 | $5,660 | $427,200 | $104,700 | $322,500 |
| 2019 | $4,980 | $425,400 | $99,700 | $325,700 |
| 2018 | $4,477 | $386,500 | $94,900 | $291,600 |
| 2017 | $4,550 | $349,900 | $90,400 | $259,500 |
| 2016 | $4,530 | $342,600 | $86,100 | $256,500 |
| 2015 | $4,310 | $337,393 | $82,459 | $254,934 |
| 2014 | -- | $327,365 | $79,174 | $248,191 |
| 2013 | -- | $293,575 | $73,031 | $220,544 |
Source: Public Records
Map
Nearby Homes
- 10684 Alameda Ave
- 10864 Alameda Ave
- 10668 Alton Ct
- 10787 Alison Way
- 4525 Alicia Dr
- 11362 Avery Dr
- 11440 Avery Dr
- 11668 Azure Ct
- 591 Autumn Oaks Ct
- 11700 Azure Ln
- 699 Calvin Ct
- 681 Summer Ln
- 11960 Albavar Path
- 11784 Azure Ln
- 11735 Azure Cir
- 11732 Azure Cir
- 11798 Azure Ln
- 4829 Redpoll Ct
- 11965 Albavar Path
- 4516 Whitetail Way
- 10762 Amherst Way
- 10758 Amherst Way
- 10756 Amherst Way
- 10764 Amherst Way
- 10759 Amherst Way
- 10754 Amherst Way
- 10765 Amherst Way
- 10766 Amherst Way
- 10753 Amherst Way
- 10752 Amherst Way
- 10773 Amherst Way
- 10768 Amherst Way
- 10777 Amherst Way
- 10749 Amherst Way
- 10748 Amherst Way
- 10774 Amherst Ct
- 10781 Amherst Way
- 10745 Amherst Way
- 10777 Amherst Ct
- 10746 Amherst Way