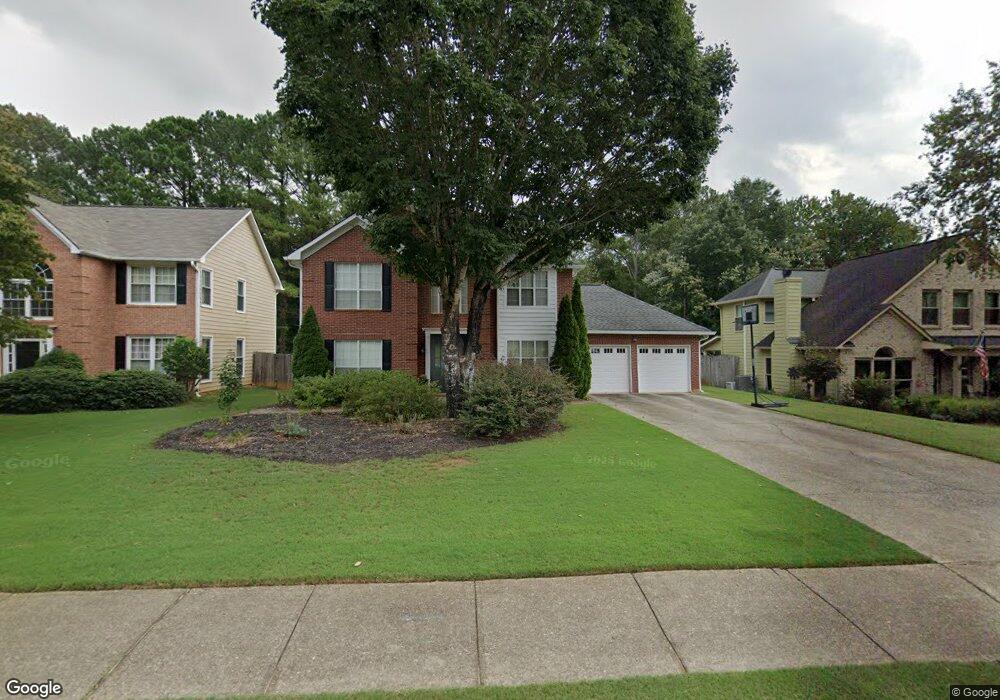
10760 Pinewalk Forest Cir Alpharetta, GA 30022
Estimated Value: $537,000 - $643,000
4
Beds
3
Baths
2,278
Sq Ft
$258/Sq Ft
Est. Value
About This Home
This home is located at 10760 Pinewalk Forest Cir, Alpharetta, GA 30022 and is currently estimated at $588,271, approximately $258 per square foot. 10760 Pinewalk Forest Cir is a home located in Fulton County with nearby schools including Ocee Elementary School, Taylor Road Middle School, and Chattahoochee High School.
Ownership History
Date
Name
Owned For
Owner Type
Purchase Details
Closed on
Apr 12, 2005
Sold by
Liming Kyle H and Liming Christina
Bought by
Frank Mark E and Frank Amy
Current Estimated Value
Home Financials for this Owner
Home Financials are based on the most recent Mortgage that was taken out on this home.
Original Mortgage
$166,000
Outstanding Balance
$85,440
Interest Rate
5.74%
Mortgage Type
New Conventional
Estimated Equity
$502,831
Purchase Details
Closed on
Feb 8, 2002
Sold by
Gallo Carlos A and Gallo Adriana L
Bought by
Liming Kyle H and Liming Christina L
Home Financials for this Owner
Home Financials are based on the most recent Mortgage that was taken out on this home.
Original Mortgage
$163,200
Interest Rate
6.81%
Mortgage Type
New Conventional
Create a Home Valuation Report for This Property
The Home Valuation Report is an in-depth analysis detailing your home's value as well as a comparison with similar homes in the area
Home Values in the Area
Average Home Value in this Area
Purchase History
| Date | Buyer | Sale Price | Title Company |
|---|---|---|---|
| Frank Mark E | $236,000 | -- | |
| Liming Kyle H | $204,000 | -- |
Source: Public Records
Mortgage History
| Date | Status | Borrower | Loan Amount |
|---|---|---|---|
| Open | Frank Mark E | $166,000 | |
| Previous Owner | Liming Kyle H | $163,200 |
Source: Public Records
Tax History Compared to Growth
Tax History
| Year | Tax Paid | Tax Assessment Tax Assessment Total Assessment is a certain percentage of the fair market value that is determined by local assessors to be the total taxable value of land and additions on the property. | Land | Improvement |
|---|---|---|---|---|
| 2025 | $429 | $223,640 | $48,200 | $175,440 |
| 2023 | $5,677 | $201,120 | $46,280 | $154,840 |
| 2022 | $2,327 | $163,960 | $36,160 | $127,800 |
| 2021 | $2,667 | $144,480 | $30,800 | $113,680 |
| 2020 | $2,667 | $128,280 | $30,520 | $97,760 |
| 2019 | $357 | $126,040 | $30,000 | $96,040 |
| 2018 | $2,699 | $112,680 | $25,360 | $87,320 |
| 2017 | $2,163 | $86,080 | $17,240 | $68,840 |
| 2016 | $2,172 | $86,440 | $17,240 | $69,200 |
| 2015 | $2,478 | $86,440 | $17,240 | $69,200 |
| 2014 | $2,259 | $86,440 | $17,240 | $69,200 |
Source: Public Records
Map
Nearby Homes
- 10945 Pinehigh Dr
- 4305 Pine Vista Blvd
- 517 Boardwalk Way
- 515 Boardwalk Way
- 513 Camden Hall Dr
- 4645 Valais Ct Unit 109
- 285 Rolling Mist Ct
- 750 Gates Ln
- 115 Willow View Point
- 4475 Hawthorn Cir
- 4465 Hawthorn Cir
- 4462 Hawthorn Cir
- 10750 Avian Dr
- 11125 Pinehigh Dr
- 11085 State Bridge Rd
- 3920 Brookline Dr
- 134 Wards Crossing Way Unit 17
- 710 Country Manor Way
- 10325 Oxford Mill Cir Unit 1
- 105 Kimball Bridge Cove
- 10750 Pinewalk Forest Cir
- 10780 Pinewalk Forest Cir
- 10740 Pinewalk Forest Cir Unit 3A
- 10765 Pinewalk Forest Cir Unit 3A
- 10755 Pinewalk Forest Cir
- 10790 Pinewalk Forest Cir
- 10775 Pinewalk Forest Cir Unit 3A
- 10745 Pinewalk Forest Cir Unit 3A
- 10730 Pinewalk Forest Cir
- 10785 Pinewalk Forest Cir
- 10800 Pinewalk Forest Cir
- 10735 Pinewalk Forest Cir
- 10795 Pinewalk Forest Cir
- 335 Pinewalk Forest Ct
- 10735 Pinewalk Forest Ct
- 315 Pinewalk Forest Ct
- 325 Pinewalk Forest Ct
- 10805 Pinewalk Forest Cir
- 10810 Pinewalk Forest Cir
- 230 Piney Hill Ct Unit 3A