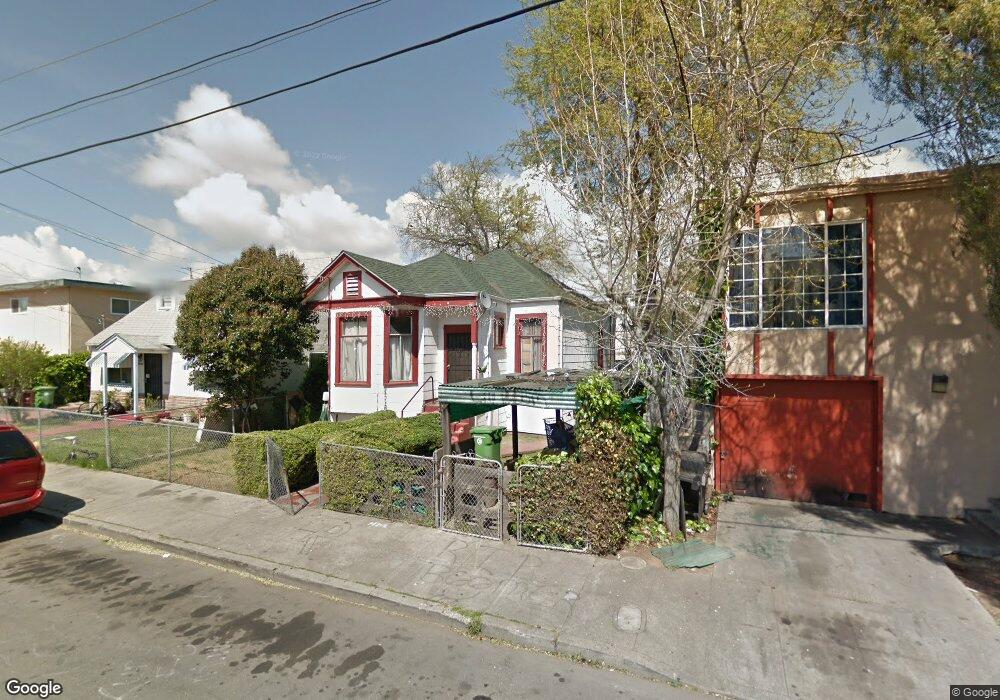
10762 Pippin St Oakland, CA 94603
South Stonehurst NeighborhoodEstimated Value: $458,000 - $494,000
2
Beds
1
Bath
943
Sq Ft
$510/Sq Ft
Est. Value
About This Home
This home is located at 10762 Pippin St, Oakland, CA 94603 and is currently estimated at $481,245, approximately $510 per square foot. 10762 Pippin St is a home located in Alameda County with nearby schools including Fred T. Korematsu Discovery Academy, Esperanza Elementary School, and Madison Park Academy (6-12).
Ownership History
Date
Name
Owned For
Owner Type
Purchase Details
Closed on
Jul 7, 2016
Sold by
Niseko Real Estate 2015 Llc
Bought by
Parada Gilberto and Parada Daniel Gustavo
Current Estimated Value
Home Financials for this Owner
Home Financials are based on the most recent Mortgage that was taken out on this home.
Original Mortgage
$304,385
Outstanding Balance
$241,332
Interest Rate
3.37%
Mortgage Type
FHA
Estimated Equity
$239,913
Purchase Details
Closed on
Dec 8, 2015
Sold by
Breckenridge Property Fund 2015 Llc
Bought by
Nisek O Real Estate 2015 Llc
Purchase Details
Closed on
Jan 21, 1994
Sold by
Shivers Willie
Bought by
Shivers Willie
Home Financials for this Owner
Home Financials are based on the most recent Mortgage that was taken out on this home.
Original Mortgage
$55,000
Interest Rate
7.21%
Create a Home Valuation Report for This Property
The Home Valuation Report is an in-depth analysis detailing your home's value as well as a comparison with similar homes in the area
Home Values in the Area
Average Home Value in this Area
Purchase History
| Date | Buyer | Sale Price | Title Company |
|---|---|---|---|
| Parada Gilberto | $310,000 | Arista National Title | |
| Nisek O Real Estate 2015 Llc | $169,500 | Accommodation | |
| Shivers Willie | -- | North American Title Company |
Source: Public Records
Mortgage History
| Date | Status | Borrower | Loan Amount |
|---|---|---|---|
| Open | Parada Gilberto | $304,385 | |
| Previous Owner | Shivers Willie | $55,000 |
Source: Public Records
Tax History Compared to Growth
Tax History
| Year | Tax Paid | Tax Assessment Tax Assessment Total Assessment is a certain percentage of the fair market value that is determined by local assessors to be the total taxable value of land and additions on the property. | Land | Improvement |
|---|---|---|---|---|
| 2025 | $6,206 | $352,773 | $107,932 | $251,841 |
| 2024 | $6,206 | $345,720 | $105,816 | $246,904 |
| 2023 | $6,447 | $345,804 | $103,741 | $242,063 |
| 2022 | $6,240 | $332,024 | $101,707 | $237,317 |
| 2021 | $5,887 | $325,378 | $99,713 | $232,665 |
| 2020 | $5,821 | $328,971 | $98,691 | $230,280 |
| 2019 | $5,552 | $322,523 | $96,757 | $225,766 |
| 2018 | $5,438 | $316,200 | $94,860 | $221,340 |
| 2017 | $5,211 | $310,000 | $93,000 | $217,000 |
| 2016 | $3,607 | $169,500 | $80,000 | $89,500 |
| 2015 | $1,650 | $17,544 | $8,772 | $8,772 |
| 2014 | $1,564 | $17,200 | $8,600 | $8,600 |
Source: Public Records
Map
Nearby Homes
- 950 Blenheim St
- 958 106th Ave
- 131 Accolade Dr
- 11070 San Leandro St
- 1009 106th Ave
- 620 El Paseo Dr
- 855 Apple St
- 1073 106th Ave
- 1050 105th Ave
- 1060 105th Ave
- 528 La Prenda Dr
- 337 Farrelly Dr
- 559 Almanza Dr
- 11132 Acalanes Dr
- 1000 102nd Ave
- 10945 Estepa Dr
- 11103 Novelda Dr
- 10906 Reposo Dr
- 527 Capistrano Dr
- 1324 104th Ave
- 10748 Pippin St
- 10778 Pippin St
- 10786 Pippin St
- 10740 Pippin St
- 10801 Russet St
- 10745 Russet St
- 10732 Pippin St
- 10741 Russet St
- 10763 Pippin St
- 10751 Pippin St
- 10777 Pippin St
- 10745 Pippin St
- 10785 Pippin St
- 10739 Russet St
- 10733 Pippin St
- 10722 Pippin St
- 10727 Pippin St
- 10719 Russet St
- 10799 Pippin St
- 10712 Pippin St