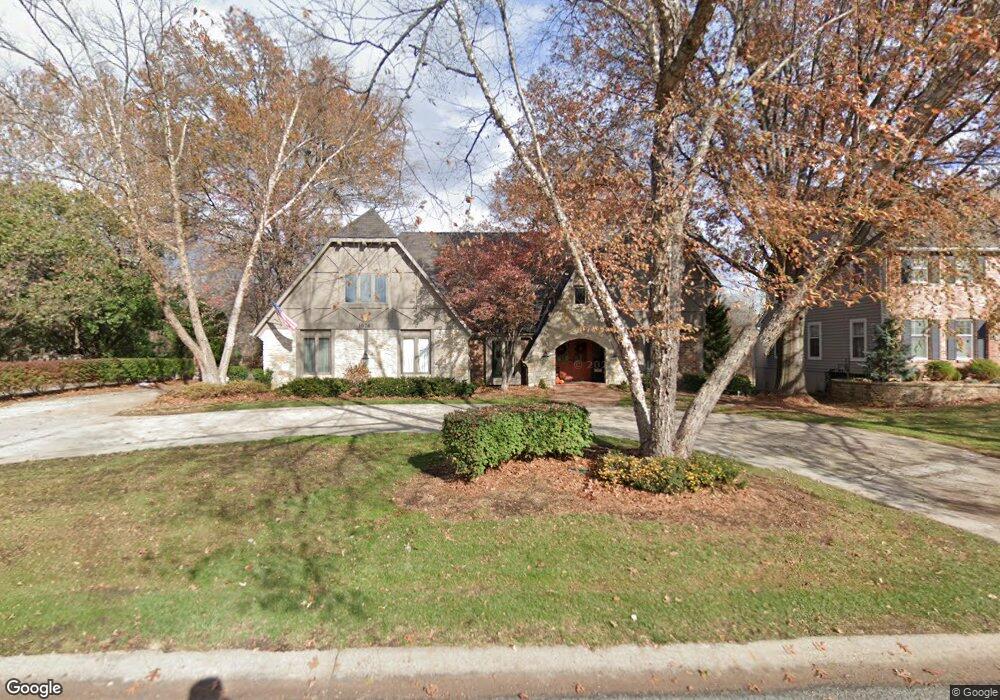
10767 Larsen St Overland Park, KS 66210
Central Overland Park NeighborhoodEstimated Value: $680,326 - $754,000
5
Beds
6
Baths
4,297
Sq Ft
$167/Sq Ft
Est. Value
About This Home
This home is located at 10767 Larsen St, Overland Park, KS 66210 and is currently estimated at $716,582, approximately $166 per square foot. 10767 Larsen St is a home located in Johnson County with nearby schools including Indian Valley Elementary School, Oxford Middle, and Blue Valley Northwest High School.
Ownership History
Date
Name
Owned For
Owner Type
Purchase Details
Closed on
Oct 27, 2022
Sold by
Constant Paul D and Constant Janis A
Bought by
Constant Paul D and Constant Janis A
Current Estimated Value
Purchase Details
Closed on
Apr 22, 2004
Sold by
Hawker Thomas S
Bought by
Citifinancial Mortgage Co
Purchase Details
Closed on
Nov 6, 2003
Sold by
Hawker Thomas S and Hawker Audrey A
Bought by
Bichelmeyer Properties Inc
Create a Home Valuation Report for This Property
The Home Valuation Report is an in-depth analysis detailing your home's value as well as a comparison with similar homes in the area
Home Values in the Area
Average Home Value in this Area
Purchase History
| Date | Buyer | Sale Price | Title Company |
|---|---|---|---|
| Constant Paul D | -- | None Listed On Document | |
| Citifinancial Mortgage Co | -- | -- | |
| Bichelmeyer Properties Inc | -- | Columbian Title Of Johnson C |
Source: Public Records
Tax History Compared to Growth
Tax History
| Year | Tax Paid | Tax Assessment Tax Assessment Total Assessment is a certain percentage of the fair market value that is determined by local assessors to be the total taxable value of land and additions on the property. | Land | Improvement |
|---|---|---|---|---|
| 2024 | $7,167 | $69,679 | $15,937 | $53,742 |
| 2023 | $6,258 | $60,019 | $15,937 | $44,082 |
| 2022 | $6,226 | $58,627 | $15,937 | $42,690 |
| 2021 | $6,165 | $55,165 | $12,750 | $42,415 |
| 2020 | $6,022 | $53,521 | $9,808 | $43,713 |
| 2019 | $6,230 | $54,188 | $7,539 | $46,649 |
| 2018 | $5,882 | $50,151 | $7,539 | $42,612 |
| 2017 | $5,441 | $45,574 | $7,539 | $38,035 |
| 2016 | $4,971 | $41,618 | $7,539 | $34,079 |
| 2015 | $4,981 | $41,515 | $7,539 | $33,976 |
| 2013 | -- | $38,594 | $7,539 | $31,055 |
Source: Public Records
Map
Nearby Homes
- 11224 Nieman Rd Unit 202
- 10529 Wedd St
- 11445 W 106th St
- 10532 Bond St
- 9805 W 104th Terrace
- 10812 W 116th St
- 9601 W 104th Terrace
- 10517 W 102nd Terrace
- 9701 W 104th St
- 10634 W 102nd Terrace
- 11608 Flint St
- 11163 Eby St
- 11606 Lucille St
- 11404 Grandview Dr
- 10311 Garnett St
- 12230 W 105th St
- 8858 W 106th Terrace
- 8819 W 106th Terrace
- 11632 Cody St
- 9006 W 104th Terrace
- 10771 Larsen St
- 10763 Larsen St
- 10772 Larsen St
- 10759 Larsen St
- 10768 Larsen St
- 10776 Larsen St
- 10779 Larsen St
- 10600 W 108th Terrace
- 10764 Larsen St
- 10755 Larsen St
- 10608 W 108th Terrace
- 10590 W 108th Terrace
- 10760 Larsen St
- 10614 W 108th Terrace
- 10700 W 109th St
- 10706 W 109th St
- 10609 W 108th Terrace
- 10756 Larsen St
- 10605 W 108th Terrace
- 10618 W 108th Terrace