10769 Fairfield Ave Las Vegas, NV 89183
Silverado Ranch NeighborhoodEstimated Value: $1,056,082 - $1,150,000
3
Beds
4
Baths
3,574
Sq Ft
$304/Sq Ft
Est. Value
About This Home
This home is located at 10769 Fairfield Ave, Las Vegas, NV 89183 and is currently estimated at $1,086,021, approximately $303 per square foot. 10769 Fairfield Ave is a home located in Clark County with nearby schools including John C. Bass Elementary School, Charles Silvestri Junior High School, and Liberty High School.
Ownership History
Date
Name
Owned For
Owner Type
Purchase Details
Closed on
Oct 31, 2006
Sold by
Thompson Michael W and Thompson Deborah A
Bought by
Thompson Michael W and Thompson Deborah Coelho
Current Estimated Value
Purchase Details
Closed on
Sep 5, 2002
Sold by
Wilson Michael B and Kimmel Jennifer A
Bought by
Thompson Michael W and Thompson Deborah A
Home Financials for this Owner
Home Financials are based on the most recent Mortgage that was taken out on this home.
Original Mortgage
$328,000
Outstanding Balance
$137,517
Interest Rate
6.29%
Estimated Equity
$948,504
Purchase Details
Closed on
Oct 6, 1998
Sold by
Del Webb Coventry Homes Of Nevada
Bought by
Wilson Michael B
Home Financials for this Owner
Home Financials are based on the most recent Mortgage that was taken out on this home.
Original Mortgage
$316,967
Interest Rate
6.78%
Create a Home Valuation Report for This Property
The Home Valuation Report is an in-depth analysis detailing your home's value as well as a comparison with similar homes in the area
Home Values in the Area
Average Home Value in this Area
Purchase History
| Date | Buyer | Sale Price | Title Company |
|---|---|---|---|
| Thompson Michael W | -- | None Available | |
| Thompson Michael W | $410,000 | United Title | |
| Wilson Michael B | $291,000 | United Title |
Source: Public Records
Mortgage History
| Date | Status | Borrower | Loan Amount |
|---|---|---|---|
| Open | Thompson Michael W | $328,000 | |
| Previous Owner | Wilson Michael B | $316,967 |
Source: Public Records
Tax History Compared to Growth
Tax History
| Year | Tax Paid | Tax Assessment Tax Assessment Total Assessment is a certain percentage of the fair market value that is determined by local assessors to be the total taxable value of land and additions on the property. | Land | Improvement |
|---|---|---|---|---|
| 2025 | $6,575 | $263,196 | $112,000 | $151,196 |
| 2024 | $6,089 | $263,196 | $112,000 | $151,196 |
| 2023 | $6,089 | $250,019 | $107,100 | $142,919 |
| 2022 | $5,638 | $204,858 | $73,500 | $131,358 |
| 2021 | $5,220 | $187,661 | $62,650 | $125,011 |
| 2020 | $4,844 | $184,927 | $60,900 | $124,027 |
| 2019 | $4,540 | $169,478 | $47,600 | $121,878 |
| 2018 | $4,332 | $165,236 | $47,600 | $117,636 |
| 2017 | $4,899 | $167,030 | $46,200 | $120,830 |
| 2016 | $4,054 | $154,050 | $33,250 | $120,800 |
| 2015 | $4,047 | $148,453 | $33,250 | $115,203 |
| 2014 | $3,929 | $132,726 | $17,500 | $115,226 |
Source: Public Records
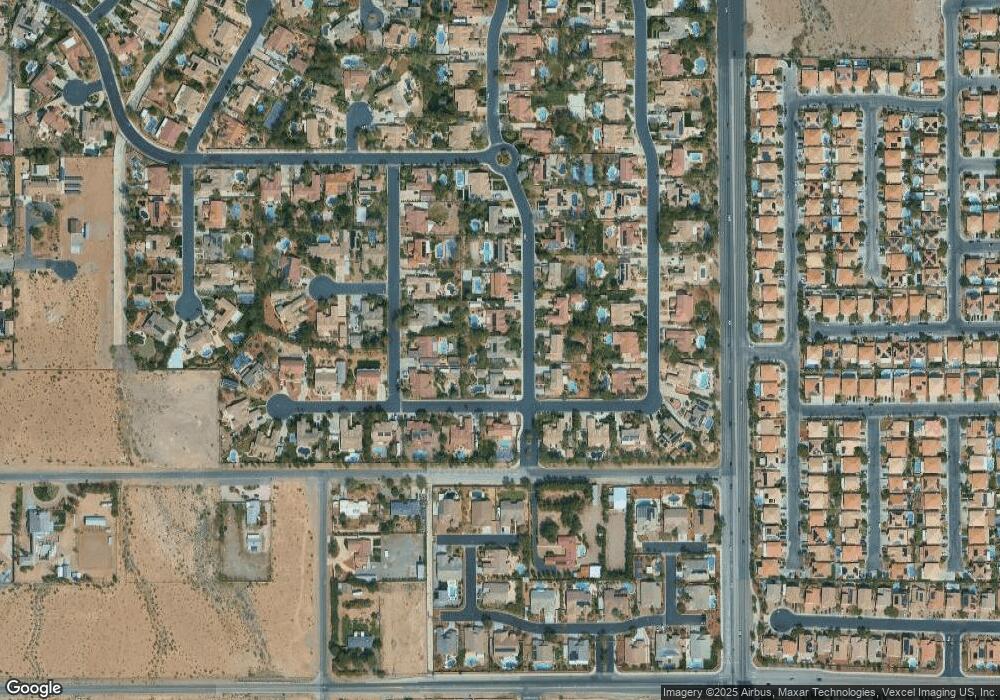
Map
Nearby Homes
- 10675 Chillingham Dr
- 276 Glenridding St
- 0 Irvin Ave
- 10658 Chillingham Dr
- 10680 Spruce Bough St
- 331 Erie Ave
- 0 Bermuda Rd Unit 2658331
- 484 Fiddlehead Ave
- 328 Hedgehope Dr
- 10802 Serendipity Ct
- 527 Leap Frog Ave
- 3756 Toscanella Ave
- 338 Azar Swan Ave
- 554 Campus Oaks Ct
- 577 Leap Frog Ave
- 0 La Cienega St
- 11033 Westcroft Way
- 10391 Celestial Echo St
- 10410 La Cienega St
- 10479 Baby Bud St
- 10749 Fairfield Ave
- 10789 Fairfield Ave
- 10768 Fairfield Ave
- 10729 Fairfield Ave
- 10768 Callington Way
- 10788 Fairfield Ave
- 10748 Callington Way
- 10788 Callington Way
- 10748 Fairfield Ave
- 349 Glenridding St
- 10728 Callington Way
- 10709 Fairfield Ave
- 10728 Fairfield Ave
- 361 Glenridding St
- 325 Glenridding St
- 10708 Callington Way
- 300 Glenridding St
- 10769 Chillingham Dr
- 301 Ivywood Ct
- 10690 Fairfield Ave