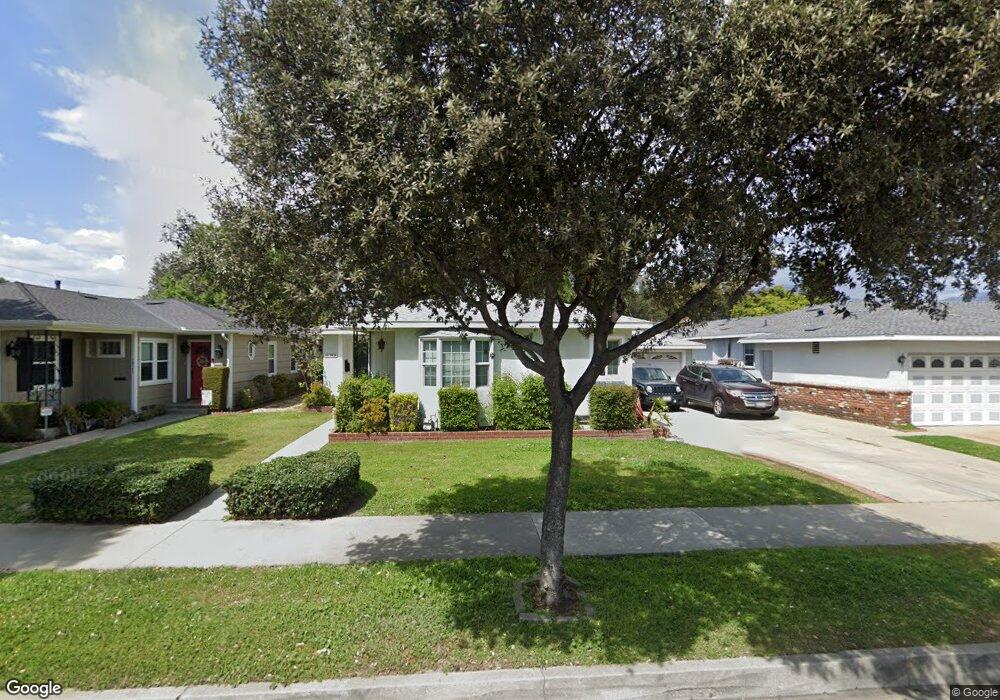
10769 Freer St Temple City, CA 91780
Estimated Value: $954,264 - $1,073,000
3
Beds
2
Baths
1,410
Sq Ft
$722/Sq Ft
Est. Value
About This Home
This home is located at 10769 Freer St, Temple City, CA 91780 and is currently estimated at $1,018,316, approximately $722 per square foot. 10769 Freer St is a home located in Los Angeles County with nearby schools including Cleminson Elementary School, Rio Hondo School, and Arroyo High School.
Ownership History
Date
Name
Owned For
Owner Type
Purchase Details
Closed on
Dec 13, 2012
Sold by
Ng Ricky
Bought by
Chang Jeanne
Current Estimated Value
Home Financials for this Owner
Home Financials are based on the most recent Mortgage that was taken out on this home.
Original Mortgage
$369,000
Outstanding Balance
$65,086
Interest Rate
3.27%
Mortgage Type
New Conventional
Estimated Equity
$953,230
Purchase Details
Closed on
Mar 19, 2010
Sold by
Meserve Louise May and Meserve David Bruce
Bought by
Chang Jeanne
Home Financials for this Owner
Home Financials are based on the most recent Mortgage that was taken out on this home.
Original Mortgage
$388,000
Interest Rate
4.94%
Mortgage Type
New Conventional
Purchase Details
Closed on
Sep 26, 2006
Sold by
Meserve Louise M and The Clarence E & Louise M Mese
Bought by
Meserve Louise May and Meserve David Bruce
Purchase Details
Closed on
Dec 4, 1995
Sold by
Meserve Family Trust
Bought by
Meserve Clarence E and Meserve Louise M
Create a Home Valuation Report for This Property
The Home Valuation Report is an in-depth analysis detailing your home's value as well as a comparison with similar homes in the area
Home Values in the Area
Average Home Value in this Area
Purchase History
| Date | Buyer | Sale Price | Title Company |
|---|---|---|---|
| Chang Jeanne | -- | First American Title Company | |
| Chang Jeanne | $485,000 | Lawyers Title | |
| Meserve Louise May | -- | None Available | |
| Meserve Clarence E | -- | -- |
Source: Public Records
Mortgage History
| Date | Status | Borrower | Loan Amount |
|---|---|---|---|
| Open | Chang Jeanne | $369,000 | |
| Closed | Chang Jeanne | $388,000 |
Source: Public Records
Tax History
| Year | Tax Paid | Tax Assessment Tax Assessment Total Assessment is a certain percentage of the fair market value that is determined by local assessors to be the total taxable value of land and additions on the property. | Land | Improvement |
|---|---|---|---|---|
| 2025 | $7,840 | $626,032 | $497,993 | $128,039 |
| 2024 | $7,840 | $613,758 | $488,229 | $125,529 |
| 2023 | $7,697 | $601,724 | $478,656 | $123,068 |
| 2022 | $7,454 | $589,926 | $469,271 | $120,655 |
| 2021 | $7,294 | $578,360 | $460,070 | $118,290 |
| 2020 | $7,269 | $572,431 | $455,353 | $117,078 |
| 2019 | $7,421 | $561,208 | $446,425 | $114,783 |
| 2018 | $7,294 | $550,205 | $437,672 | $112,533 |
| 2016 | $6,992 | $528,842 | $420,678 | $108,164 |
| 2015 | $6,920 | $520,900 | $414,360 | $106,540 |
| 2014 | $6,626 | $510,698 | $406,244 | $104,454 |
Source: Public Records
Map
Nearby Homes
- 10720 Freer St
- 5436 Mcculloch Ave Unit F
- 5138 Daleview Ave
- 10660 Daines Dr
- 5133 Pal Mal Ave
- 4951 Mcclintock Ave
- 4928 El Monte Ave
- 5530 Welland Ave Unit 14
- 5533 Santa Anita Ave
- 4800 Daleview Ave Unit 121
- 4800 Daleview Ave Unit 41
- 4800 Daleview Ave Unit 85
- 4800 Daleview Ave Unit 18
- 5122 Halifax Rd
- 5111 Halifax Rd
- 5224 Hallowell Ave
- 5337 Tyler Ave
- 127 Las Tunas Dr
- 27 Miren Place
- 5352 Marshburn Ave
- 10777 Freer St
- 10765 Freer St
- 10776 Blackley St
- 10783 Freer St
- 5323 Parmerton Ave
- 5241 Mcclintock Ave
- 10780 Blackley St
- 10764 Freer St
- 10789 Freer St
- 10786 Blackley St
- 5327 Parmerton Ave
- 10749 Freer St
- 5233 Mcclintock Ave
- 5240 Mcclintock Ave
- 10791 Freer St
- 10792 Blackley St
- 5314 Persimmon Ave
- 5220 Persimmon Ave
- 5333 Parmerton Ave
- 10781 Blackley St
Your Personal Tour Guide
Ask me questions while you tour the home.