Estimated Value: $446,000 - $494,000
3
Beds
2
Baths
2,825
Sq Ft
$164/Sq Ft
Est. Value
About This Home
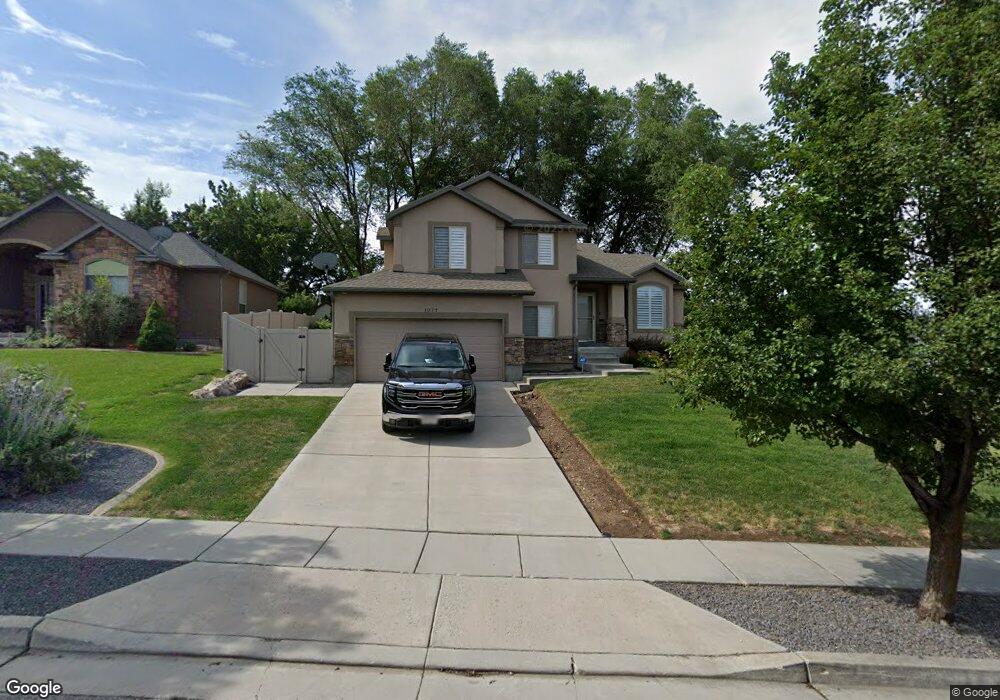
This home is located at 1077 Bench View Dr, Ogden, UT 84404 and is currently estimated at $462,161, approximately $163 per square foot. 1077 Bench View Dr is a home located in Weber County with nearby schools including Highland Junior High School, Ben Lomond High School, and Greenwood Charter School.
Ownership History
Date
Name
Owned For
Owner Type
Purchase Details
Closed on
May 15, 2018
Sold by
Conway Paul L and Storm Conway Sndra
Bought by
Reyhani Kayvon and Reyhani Faramarz
Current Estimated Value
Purchase Details
Closed on
Jul 11, 2007
Sold by
Conway Paul L and Strom Conway Sandra
Bought by
Conway Paul L and Storm Conway Sandra
Home Financials for this Owner
Home Financials are based on the most recent Mortgage that was taken out on this home.
Original Mortgage
$61,000
Interest Rate
6.11%
Mortgage Type
Stand Alone Second
Purchase Details
Closed on
Aug 24, 2006
Sold by
R & R Development Llc
Bought by
Accent Homes Inc
Create a Home Valuation Report for This Property
The Home Valuation Report is an in-depth analysis detailing your home's value as well as a comparison with similar homes in the area
Home Values in the Area
Average Home Value in this Area
Purchase History
| Date | Buyer | Sale Price | Title Company |
|---|---|---|---|
| Reyhani Kayvon | -- | Integrated Title Ins Svcs | |
| Conway Paul L | -- | Equity Title South Ogden | |
| Accent Homes Inc | -- | Bonneville Superior Title Co |
Source: Public Records
Mortgage History
| Date | Status | Borrower | Loan Amount |
|---|---|---|---|
| Previous Owner | Conway Paul L | $61,000 |
Source: Public Records
Tax History
| Year | Tax Paid | Tax Assessment Tax Assessment Total Assessment is a certain percentage of the fair market value that is determined by local assessors to be the total taxable value of land and additions on the property. | Land | Improvement |
|---|---|---|---|---|
| 2025 | $3,263 | $242,724 | $91,209 | $151,515 |
| 2024 | $3,218 | $237,599 | $91,208 | $146,391 |
| 2023 | $3,366 | $252,450 | $87,038 | $165,412 |
| 2022 | $3,203 | $241,450 | $70,587 | $170,863 |
| 2021 | $2,772 | $344,000 | $78,110 | $265,890 |
| 2020 | $2,574 | $294,000 | $57,551 | $236,449 |
| 2019 | $2,504 | $268,000 | $57,551 | $210,449 |
| 2018 | $2,324 | $246,000 | $57,551 | $188,449 |
| 2017 | $170 | $237,000 | $50,180 | $186,820 |
| 2016 | $165 | $130,275 | $28,186 | $102,089 |
| 2015 | $148 | $112,917 | $28,186 | $84,731 |
| 2014 | $141 | $90,791 | $28,186 | $62,605 |
Source: Public Records
Map
Nearby Homes
- 1047 E 800 N
- 955 E 825 N
- 951 E 825 N
- 1189 E Benchview Dr
- 1019 E 1100 N
- 569 N Van Buren Ave
- 572 N Van Buren Ave
- 1042 N Gramercy Ave
- 986 E 1200 N
- 826 E 760 N
- 827 E 760 N
- 965 N Liberty Ave
- 308 E 1275 N Unit 111
- 314 E 1275 N Unit 113
- 306 E 1275 N Unit 110
- 1349 N Lewis Peak Dr
- 788 North St
- 869 E 1325 N
- 370 N Liberty Cove Dr Unit 5
- 1055 Collins Blvd
- 1077 E Benchview Dr
- 1077 E Benchview Dr Unit 1
- 1089 E Benchview Dr
- 1089 E Benchview Dr Unit 2
- 1089 Bench View Dr Unit 2
- 1089 Bench View Dr
- 1101 E Benchview Dr
- 1101 E Benchview Dr Unit 3
- 1101 Bench View Dr
- 1101 E Benchview Dr Unit 3
- 1080 E Benchview Dr
- 1080 E Benchview Dr Unit 25
- 1080 Avalon Hills Dr
- 1092 E Benchview Dr
- 1038 E 900 N
- 1104 E Benchview Dr
- 1104 E Benchview Dr Unit 23
- 1088 Avalon Hills Dr
- 1111 E Benchview Dr
- 880 N Harrison Blvd
Your Personal Tour Guide
Ask me questions while you tour the home.