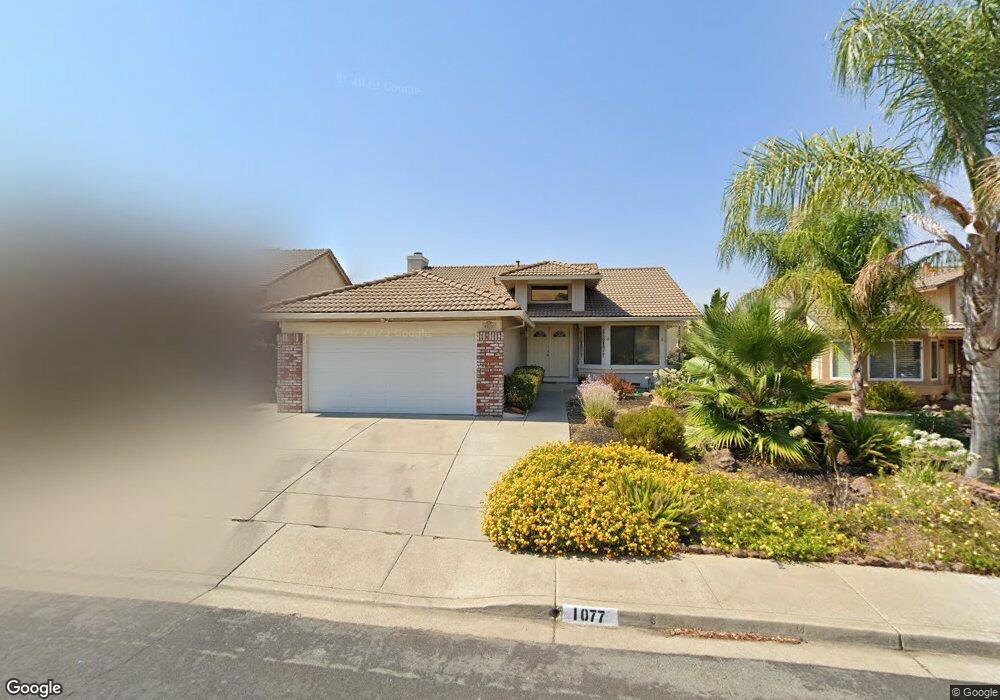
1077 Discovery Way Concord, CA 94521
The Highlands NeighborhoodEstimated Value: $966,692 - $1,126,000
4
Beds
3
Baths
1,953
Sq Ft
$541/Sq Ft
Est. Value
About This Home
This home is located at 1077 Discovery Way, Concord, CA 94521 and is currently estimated at $1,055,673, approximately $540 per square foot. 1077 Discovery Way is a home located in Contra Costa County with nearby schools including Highlands Elementary School, Mt. Diablo Elementary School, and Pine Hollow Middle School.
Ownership History
Date
Name
Owned For
Owner Type
Purchase Details
Closed on
Apr 22, 2020
Sold by
Singh Debbie
Bought by
Singh Debbie S
Current Estimated Value
Purchase Details
Closed on
Feb 28, 2008
Sold by
Singh Hardev and Singh Vidya
Bought by
Singh Hardev and Singh Vidya
Purchase Details
Closed on
Jun 14, 2005
Sold by
Yaple James R
Bought by
Singh Hardev and Singh Vidya
Home Financials for this Owner
Home Financials are based on the most recent Mortgage that was taken out on this home.
Original Mortgage
$381,050
Outstanding Balance
$188,856
Interest Rate
4.98%
Mortgage Type
Purchase Money Mortgage
Estimated Equity
$866,817
Create a Home Valuation Report for This Property
The Home Valuation Report is an in-depth analysis detailing your home's value as well as a comparison with similar homes in the area
Home Values in the Area
Average Home Value in this Area
Purchase History
| Date | Buyer | Sale Price | Title Company |
|---|---|---|---|
| Singh Debbie S | -- | None Available | |
| Singh Hardev | -- | None Available | |
| Singh Hardev | $725,000 | California Title Co Northern |
Source: Public Records
Mortgage History
| Date | Status | Borrower | Loan Amount |
|---|---|---|---|
| Open | Singh Hardev | $381,050 |
Source: Public Records
Tax History
| Year | Tax Paid | Tax Assessment Tax Assessment Total Assessment is a certain percentage of the fair market value that is determined by local assessors to be the total taxable value of land and additions on the property. | Land | Improvement |
|---|---|---|---|---|
| 2025 | $12,330 | $1,010,571 | $679,527 | $331,044 |
| 2024 | $11,828 | $990,756 | $666,203 | $324,553 |
| 2023 | $11,828 | $971,331 | $653,141 | $318,190 |
| 2022 | $11,692 | $952,286 | $640,335 | $311,951 |
| 2021 | $10,379 | $840,000 | $564,832 | $275,168 |
| 2019 | $9,865 | $786,000 | $528,520 | $257,480 |
| 2018 | $9,498 | $770,000 | $517,762 | $252,238 |
| 2017 | $8,884 | $726,500 | $488,511 | $237,989 |
| 2016 | $8,174 | $668,000 | $449,174 | $218,826 |
| 2015 | $7,459 | $600,500 | $403,786 | $196,714 |
| 2014 | $6,947 | $553,500 | $372,182 | $181,318 |
Source: Public Records
Map
Nearby Homes
- 1109 Vista Point Ln
- 5260 Hiddencrest Ct
- 911 Autumn Oak Cir
- 995 Rosehedge Ct
- 974 Rosehedge Ct
- 5256 Pebble Glen Dr
- 1297 Kansas Cir
- 1002 Pinehurst Ct
- 5092 Black Oak Rd
- 1025 Pinehurst Ct
- 5442 Roundtree Ct Unit A
- 1195 Kenwal Rd Unit C
- 1175 Kenwal Rd Unit B
- 5468 Roundtree Dr Unit C
- 5451 Roundtree Place Unit F
- 5535 Merritt Dr
- 5324 Swainsons Ct
- 5244 S Montecito Dr
- 5492 Roundtree Dr Unit A
- 5506 Nebraska Dr
- 1075 Discovery Way
- 1079 Discovery Way
- 1081 Discovery Way
- 1073 Discovery Way
- 1071 Discovery Way
- 1083 Discovery Way
- 1074 Discovery Way
- 1069 Discovery Way
- 1085 Discovery Way
- 1072 Discovery Way
- 1070 Discovery Way
- 1067 Discovery Way
- 1087 Discovery Way
- 1089 Discovery Way
- 1088 Discovery Way
- 1091 Discovery Way
- 1090 Discovery Way
- 1093 Discovery Way
- 1095 Discovery Way
- 1092 Discovery Way
Your Personal Tour Guide
Ask me questions while you tour the home.