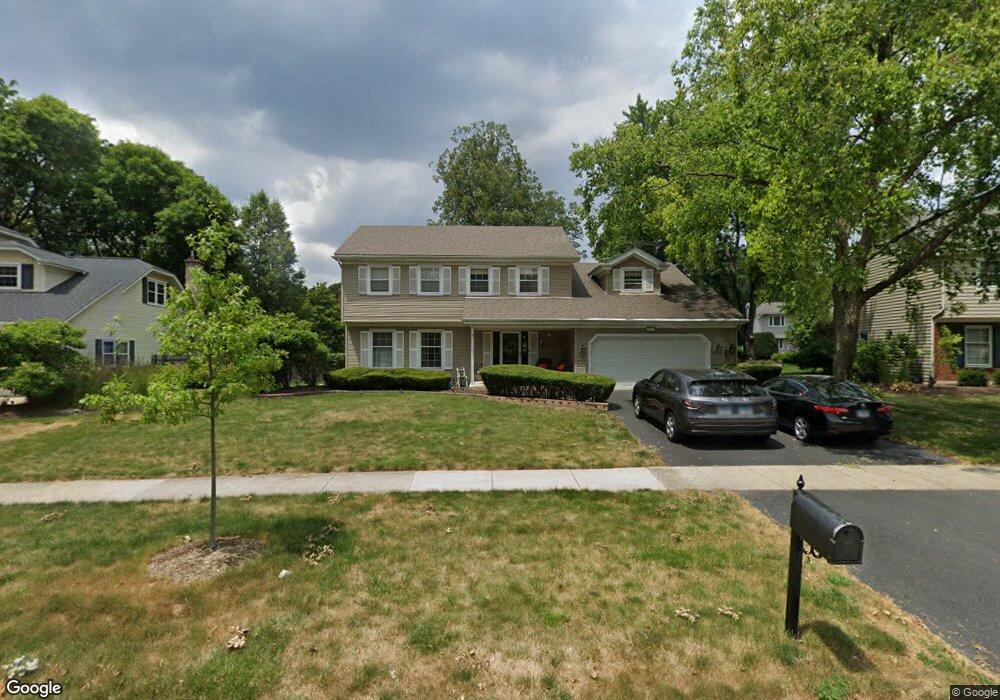
1077 E Gartner Rd Naperville, IL 60540
Hobson Village NeighborhoodEstimated Value: $637,000 - $720,000
4
Beds
3
Baths
2,686
Sq Ft
$258/Sq Ft
Est. Value
About This Home
This home is located at 1077 E Gartner Rd, Naperville, IL 60540 and is currently estimated at $692,217, approximately $257 per square foot. 1077 E Gartner Rd is a home located in DuPage County with nearby schools including Prairie Elementary School, Washington Jr High School, and Naperville North High School.
Ownership History
Date
Name
Owned For
Owner Type
Purchase Details
Closed on
Jun 26, 2009
Sold by
Modi Kanubhai and Modi Geeta
Bought by
Melgoza Tomas and Melgoza Melissa V
Current Estimated Value
Home Financials for this Owner
Home Financials are based on the most recent Mortgage that was taken out on this home.
Original Mortgage
$376,475
Outstanding Balance
$235,939
Interest Rate
4.86%
Mortgage Type
FHA
Estimated Equity
$456,278
Purchase Details
Closed on
Aug 7, 1998
Sold by
Rohling Robert E and Rohling Kim M
Bought by
Modi Kanubhai and Modi Geeta
Purchase Details
Closed on
Jun 11, 1998
Sold by
Rohling Robert E
Bought by
Rohling Robert E and Rohling Kim M
Purchase Details
Closed on
Nov 6, 1995
Sold by
Salemi George A and Salemi Carol A
Bought by
Rohling Robert E
Home Financials for this Owner
Home Financials are based on the most recent Mortgage that was taken out on this home.
Original Mortgage
$183,900
Interest Rate
7.65%
Create a Home Valuation Report for This Property
The Home Valuation Report is an in-depth analysis detailing your home's value as well as a comparison with similar homes in the area
Home Values in the Area
Average Home Value in this Area
Purchase History
| Date | Buyer | Sale Price | Title Company |
|---|---|---|---|
| Melgoza Tomas | $390,000 | Atg | |
| Modi Kanubhai | $263,000 | -- | |
| Rohling Robert E | -- | -- | |
| Rohling Robert E | $230,000 | Law Title |
Source: Public Records
Mortgage History
| Date | Status | Borrower | Loan Amount |
|---|---|---|---|
| Open | Melgoza Tomas | $376,475 | |
| Previous Owner | Rohling Robert E | $183,900 |
Source: Public Records
Tax History
| Year | Tax Paid | Tax Assessment Tax Assessment Total Assessment is a certain percentage of the fair market value that is determined by local assessors to be the total taxable value of land and additions on the property. | Land | Improvement |
|---|---|---|---|---|
| 2024 | $11,526 | $196,142 | $76,798 | $119,344 |
| 2023 | $11,112 | $179,010 | $70,090 | $108,920 |
| 2022 | $10,645 | $170,480 | $66,750 | $103,730 |
| 2021 | $10,258 | $164,040 | $64,230 | $99,810 |
| 2020 | $10,041 | $161,100 | $63,080 | $98,020 |
| 2019 | $9,750 | $154,130 | $60,350 | $93,780 |
| 2018 | $9,753 | $154,130 | $60,350 | $93,780 |
| 2017 | $9,558 | $148,930 | $58,310 | $90,620 |
| 2016 | $9,368 | $143,540 | $56,200 | $87,340 |
| 2015 | $9,311 | $135,170 | $52,920 | $82,250 |
| 2014 | $8,957 | $126,330 | $49,460 | $76,870 |
| 2013 | $8,822 | $126,630 | $49,580 | $77,050 |
Source: Public Records
Map
Nearby Homes
- 923 Tim Tam Cir
- 908 Julian Ct
- 820 Prairie Ave
- 712 E Hillside Rd
- 616 Driftwood Ct
- 740 Prairie Ave
- 488 S Columbia St
- 706 S Loomis St Unit D
- 707 Thornwood Dr
- 932 E Chicago Ave
- 226 S Columbia St
- 1172 Kenilworth Cir
- 221 Olesen Dr
- 203 S Columbia St
- 24 S Huffman St
- 661 Willow Rd
- 311 Millcreek Ln
- 1204 Hobson Oaks Ct Unit 1204
- 5 N Columbia St
- 313 W Gartner Rd
- 1081 E Gartner Rd
- 1073 E Gartner Rd
- 1014 Whirlaway Ave
- 1018 Whirlaway Ave
- 1085 E Gartner Rd Unit 3
- 1010 Whirlaway Ave
- 1069 E Gartner Rd
- 1022 Whirlaway Ave
- 1080 E Gartner Rd
- 1072 E Gartner Rd
- 1086 E Gartner Rd
- 1026 Whirlaway Ave
- 1089 E Gartner Rd
- 1066 E Gartner Rd
- 1063 E Gartner Rd Unit 3
- 1030 Whirlaway Ave
- 1002 Whirlaway Ave
- 1077 Challdon Ct
- 701 S Charles Ave Unit 3
- 609 Count Fleet Ct
Your Personal Tour Guide
Ask me questions while you tour the home.