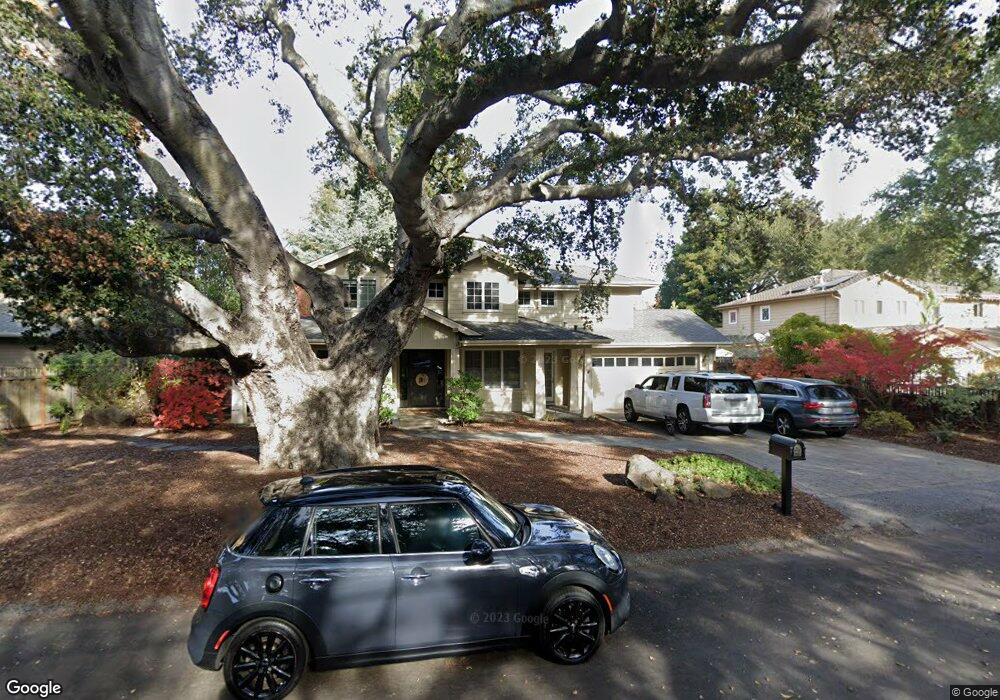
1077 Muir Way Los Altos, CA 94024
Estimated Value: $5,168,000 - $5,492,323
4
Beds
5
Baths
3,211
Sq Ft
$1,656/Sq Ft
Est. Value
About This Home
This home is located at 1077 Muir Way, Los Altos, CA 94024 and is currently estimated at $5,316,331, approximately $1,655 per square foot. 1077 Muir Way is a home located in Santa Clara County with nearby schools including Oak Avenue Elementary School, Georgina P. Blach Junior High School, and Mountain View High School.
Ownership History
Date
Name
Owned For
Owner Type
Purchase Details
Closed on
Mar 20, 2012
Sold by
Jarrell John P and Jarrell Lee Ann
Bought by
Blake Richard C and Blake Jennie H
Current Estimated Value
Home Financials for this Owner
Home Financials are based on the most recent Mortgage that was taken out on this home.
Original Mortgage
$2,104,000
Outstanding Balance
$1,356,440
Interest Rate
2.62%
Mortgage Type
New Conventional
Estimated Equity
$3,959,891
Purchase Details
Closed on
Dec 19, 2006
Sold by
Muir Way Llc
Bought by
Jarrell John P and Jarrell Lee Ann
Home Financials for this Owner
Home Financials are based on the most recent Mortgage that was taken out on this home.
Original Mortgage
$1,500,000
Interest Rate
6.12%
Mortgage Type
Purchase Money Mortgage
Create a Home Valuation Report for This Property
The Home Valuation Report is an in-depth analysis detailing your home's value as well as a comparison with similar homes in the area
Home Values in the Area
Average Home Value in this Area
Purchase History
| Date | Buyer | Sale Price | Title Company |
|---|---|---|---|
| Blake Richard C | $2,630,000 | Chicago Title Company | |
| Jarrell John P | -- | Chicago Title Company |
Source: Public Records
Mortgage History
| Date | Status | Borrower | Loan Amount |
|---|---|---|---|
| Open | Blake Richard C | $2,104,000 | |
| Previous Owner | Jarrell John P | $1,500,000 |
Source: Public Records
Tax History Compared to Growth
Tax History
| Year | Tax Paid | Tax Assessment Tax Assessment Total Assessment is a certain percentage of the fair market value that is determined by local assessors to be the total taxable value of land and additions on the property. | Land | Improvement |
|---|---|---|---|---|
| 2025 | $39,357 | $3,303,421 | $1,884,081 | $1,419,340 |
| 2024 | $39,357 | $3,238,649 | $1,847,139 | $1,391,510 |
| 2023 | $39,069 | $3,175,147 | $1,810,921 | $1,364,226 |
| 2022 | $37,861 | $3,112,890 | $1,775,413 | $1,337,477 |
| 2021 | $37,908 | $3,051,853 | $1,740,601 | $1,311,252 |
| 2020 | $38,560 | $3,020,561 | $1,722,754 | $1,297,807 |
| 2019 | $36,589 | $2,961,335 | $1,688,975 | $1,272,360 |
| 2018 | $36,128 | $2,903,270 | $1,655,858 | $1,247,412 |
| 2017 | $34,476 | $2,846,344 | $1,623,391 | $1,222,953 |
| 2016 | $33,876 | $2,790,534 | $1,591,560 | $1,198,974 |
| 2015 | $33,484 | $2,748,619 | $1,567,654 | $1,180,965 |
| 2014 | $33,450 | $2,694,778 | $1,536,946 | $1,157,832 |
Source: Public Records
Map
Nearby Homes
- 781 Covington Rd
- 1747 Walnut Dr
- 2741 Doverton Square
- 654 Lola Ln
- 1631 Grant Rd
- 1127 Hillslope Place
- 191 E El Camino Real Unit 138
- 1190 Maria Privada
- 1669 Whitham Ave
- 1125 Plymouth Dr
- 717 Ehrhorn Ave
- 1033 Crestview Dr Unit 207
- 88 Church St
- 1881 Alford Ave
- 1341 Belleville Way
- 1264 Brookings Ln
- 920 Oxford Dr
- 11637 Rebecca Ln
- 780 S El Monte Ave
- 477 Lassen St Unit 9
- 1097 Muir Way
- 1065 Muir Way
- 1018 Eastwood Dr
- 1078 Muir Way
- 1102 Covington Rd
- 1107 Muir Way
- 1072 Muir Way
- 1108 Muir Way
- 1066 Muir Way
- 1029 Eastwood Dr
- 1009 Eastwood Dr
- 1042 Eastwood Dr
- 1089 Eastwood Ct
- 1085 Eastwood Ct
- 1081 Eastwood Ct
- 1093 Eastwood Ct
- 1033 Eastwood Dr
- 1077 Eastwood Ct
- 1000 Eastwood Dr
- 1046 Eastwood Dr