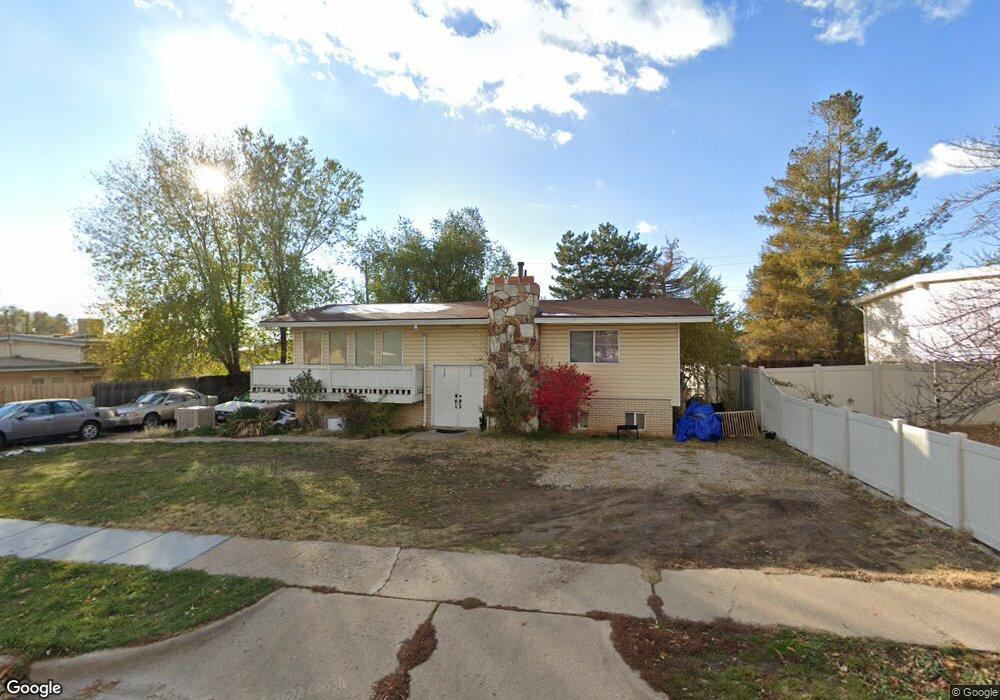
1077 N 300 W Layton, UT 84041
Estimated Value: $406,120 - $433,000
3
Beds
2
Baths
2,160
Sq Ft
$195/Sq Ft
Est. Value
About This Home
This home is located at 1077 N 300 W, Layton, UT 84041 and is currently estimated at $420,780, approximately $194 per square foot. 1077 N 300 W is a home located in Davis County with nearby schools including Crestview Elementary School, Central Davis Junior High School, and Northridge High School.
Ownership History
Date
Name
Owned For
Owner Type
Purchase Details
Closed on
Jan 14, 2005
Sold by
Jessop Scott
Bought by
Brandley Sheila Kay
Current Estimated Value
Home Financials for this Owner
Home Financials are based on the most recent Mortgage that was taken out on this home.
Original Mortgage
$120,074
Outstanding Balance
$60,413
Interest Rate
5.8%
Mortgage Type
FHA
Estimated Equity
$360,367
Purchase Details
Closed on
Aug 31, 2004
Sold by
Stockhaus Shaun D and Stockhaus Kaci
Bought by
Jessop Scott
Home Financials for this Owner
Home Financials are based on the most recent Mortgage that was taken out on this home.
Original Mortgage
$95,200
Interest Rate
8.4%
Mortgage Type
Purchase Money Mortgage
Purchase Details
Closed on
Aug 19, 1997
Sold by
Corsair Ward K and Corsair Kimberly D
Bought by
Stockhaus Shaun D and Stockhaus Kaci
Home Financials for this Owner
Home Financials are based on the most recent Mortgage that was taken out on this home.
Original Mortgage
$106,080
Interest Rate
8.25%
Mortgage Type
VA
Create a Home Valuation Report for This Property
The Home Valuation Report is an in-depth analysis detailing your home's value as well as a comparison with similar homes in the area
Home Values in the Area
Average Home Value in this Area
Purchase History
We collect this data history from publicly available records. To have your information removed, we recommend requesting removal directly through your county’s website.
| Date | Buyer | Sale Price | Title Company |
|---|---|---|---|
| Brandley Sheila Kay | -- | First American Title | |
| Jessop Scott | -- | First American Title Co | |
| Stockhaus Shaun D | -- | Associated Title Company |
Source: Public Records
Mortgage History
We collect this data history from publicly available records. To have your information removed, we recommend requesting removal directly through your county’s website.
| Date | Status | Borrower | Loan Amount |
|---|---|---|---|
| Open | Brandley Sheila Kay | $120,074 | |
| Previous Owner | Jessop Scott | $95,200 | |
| Previous Owner | Stockhaus Shaun D | $106,080 |
Source: Public Records
Tax History
| Year | Tax Paid | Tax Assessment Tax Assessment Total Assessment is a certain percentage of the fair market value that is determined by local assessors to be the total taxable value of land and additions on the property. | Land | Improvement |
|---|---|---|---|---|
| 2025 | $1,902 | $199,650 | $100,178 | $99,472 |
| 2024 | $1,826 | $193,051 | $116,837 | $76,214 |
| 2023 | $1,840 | $343,000 | $140,713 | $202,287 |
| 2022 | $1,831 | $185,350 | $74,266 | $111,084 |
| 2021 | $1,623 | $245,000 | $103,826 | $141,174 |
| 2020 | $1,485 | $215,000 | $87,509 | $127,491 |
| 2019 | $1,509 | $214,000 | $83,247 | $130,753 |
| 2018 | $1,334 | $190,000 | $83,247 | $106,753 |
| 2016 | $1,216 | $89,320 | $26,501 | $62,819 |
| 2015 | $1,134 | $79,090 | $26,501 | $52,589 |
| 2014 | $1,108 | $79,015 | $26,501 | $52,514 |
| 2013 | -- | $73,112 | $18,612 | $54,500 |
Source: Public Records
Map
Nearby Homes
Your Personal Tour Guide
Ask me questions while you tour the home.