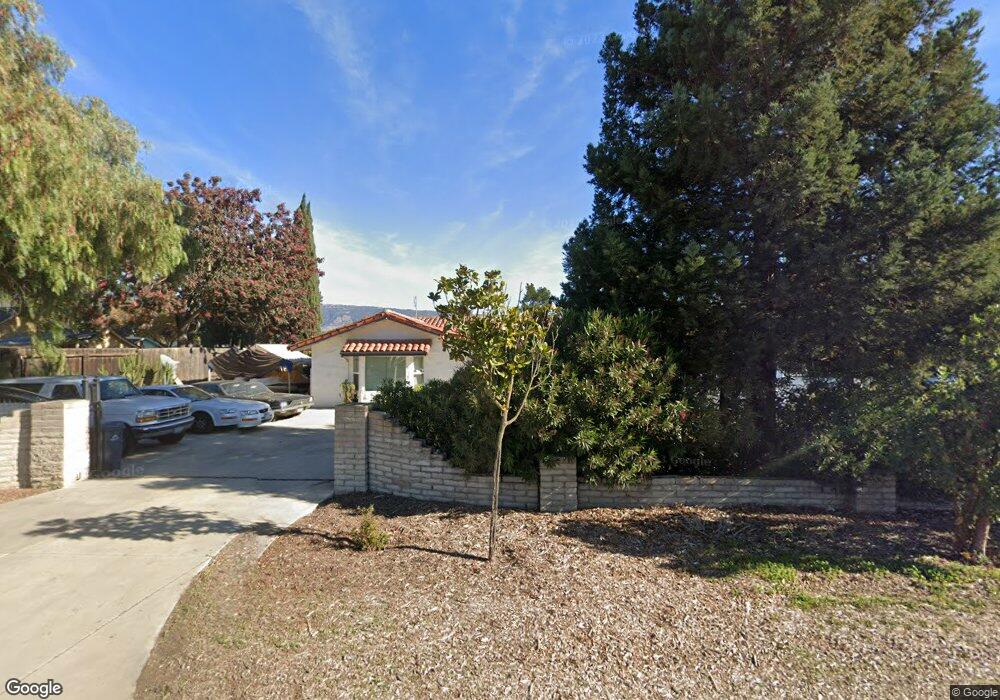
10770 6th St Gilroy, CA 95020
Estimated Value: $879,000 - $1,539,000
3
Beds
2
Baths
1,446
Sq Ft
$782/Sq Ft
Est. Value
About This Home
This home is located at 10770 6th St, Gilroy, CA 95020 and is currently estimated at $1,131,176, approximately $782 per square foot. 10770 6th St is a home located in Santa Clara County with nearby schools including Rucker Elementary School, Solorsano Middle School, and Christopher High School.
Ownership History
Date
Name
Owned For
Owner Type
Purchase Details
Closed on
Sep 12, 2003
Sold by
Marquez Anthony
Bought by
Marquez Anthony J
Current Estimated Value
Home Financials for this Owner
Home Financials are based on the most recent Mortgage that was taken out on this home.
Original Mortgage
$385,000
Outstanding Balance
$179,338
Interest Rate
6.3%
Mortgage Type
Stand Alone First
Estimated Equity
$951,838
Purchase Details
Closed on
Aug 21, 1997
Sold by
Amezquita Ismael A
Bought by
Marquez Anthony
Purchase Details
Closed on
Sep 13, 1994
Sold by
Dinzillo Arthur and Dinzillo Ida
Bought by
Amezquita Ismael A
Home Financials for this Owner
Home Financials are based on the most recent Mortgage that was taken out on this home.
Original Mortgage
$195,760
Interest Rate
8.37%
Mortgage Type
Purchase Money Mortgage
Create a Home Valuation Report for This Property
The Home Valuation Report is an in-depth analysis detailing your home's value as well as a comparison with similar homes in the area
Purchase History
| Date | Buyer | Sale Price | Title Company |
|---|---|---|---|
| Marquez Anthony J | -- | Alliance Title Company | |
| Marquez Anthony | -- | -- | |
| Amezquita Ismael A | $245,000 | Chicago Title Company |
Source: Public Records
Mortgage History
| Date | Status | Borrower | Loan Amount |
|---|---|---|---|
| Open | Marquez Anthony J | $385,000 | |
| Previous Owner | Amezquita Ismael A | $195,760 | |
| Closed | Amezquita Ismael A | $24,470 |
Source: Public Records
Tax History
| Year | Tax Paid | Tax Assessment Tax Assessment Total Assessment is a certain percentage of the fair market value that is determined by local assessors to be the total taxable value of land and additions on the property. | Land | Improvement |
|---|---|---|---|---|
| 2025 | $5,778 | $479,006 | $239,503 | $239,503 |
| 2024 | $5,778 | $469,614 | $234,807 | $234,807 |
| 2023 | $5,734 | $460,406 | $230,203 | $230,203 |
| 2022 | $5,630 | $451,380 | $225,690 | $225,690 |
| 2021 | $5,601 | $442,530 | $221,265 | $221,265 |
| 2020 | $5,533 | $437,994 | $218,997 | $218,997 |
| 2019 | $5,565 | $429,406 | $214,703 | $214,703 |
| 2018 | $5,176 | $420,988 | $210,494 | $210,494 |
| 2017 | $5,283 | $412,734 | $206,367 | $206,367 |
| 2016 | $5,170 | $404,642 | $202,321 | $202,321 |
| 2015 | $4,869 | $398,564 | $199,282 | $199,282 |
| 2014 | $4,797 | $390,758 | $195,379 | $195,379 |
Source: Public Records
Map
Nearby Homes
- 615 Rucker Ave
- 145 Masten Ave
- 310 Lena Ave
- 0 Rucker Ave
- 2055 Rucker Ave
- 0 Buena Vista Ave
- 0A Buena Vista Ave
- 730 Lepa Ct
- 12155 Columbet Ave
- 170 Sturla Way
- 2015 Trumar Ln
- 119 Farrell Ave
- 103 Farrell Ave
- 111 Farrell Ave
- 700 Las Animas Ave
- 0 New Ave
- 1180 Day Rd
- 1080 Sunrise Dr
- 12785 Murphy Ave
- 1925 Church Ave
Your Personal Tour Guide
Ask me questions while you tour the home.