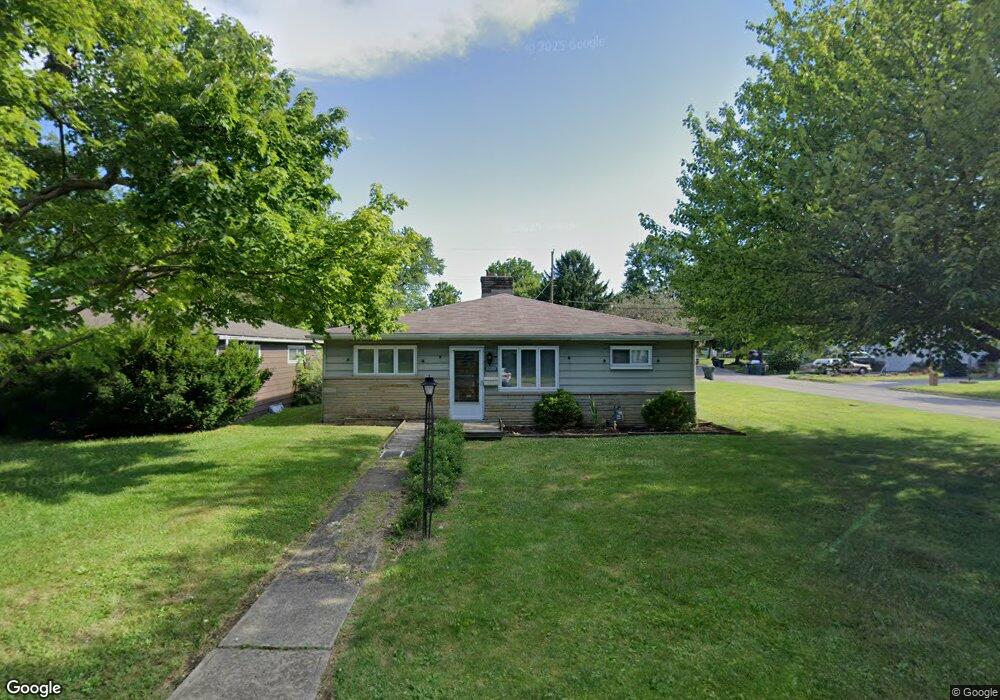
1078 Elmore Ave Columbus, OH 43224
North Linden NeighborhoodEstimated Value: $240,000 - $277,000
3
Beds
2
Baths
1,400
Sq Ft
$184/Sq Ft
Est. Value
About This Home
This home is located at 1078 Elmore Ave, Columbus, OH 43224 and is currently estimated at $257,544, approximately $183 per square foot. 1078 Elmore Ave is a home located in Franklin County with nearby schools including Maize Road Elementary School, Medina Middle School, and Mifflin High School.
Ownership History
Date
Name
Owned For
Owner Type
Purchase Details
Closed on
Aug 3, 2017
Sold by
Marsh Marvin M and Marsh Sherrie E
Bought by
Stamplicker Enterprises Llc
Current Estimated Value
Purchase Details
Closed on
May 30, 2008
Sold by
Deutsche Bank National Trust Co
Bought by
Marsh Marvin M and Marsh Sherrie E
Purchase Details
Closed on
Mar 6, 2008
Sold by
Collins Desiree and Case #07Cve06 7753
Bought by
Deutsche Bank National Trust Co and Fremont Home Loan Trust 2006-1
Purchase Details
Closed on
Jan 30, 2006
Sold by
Stalter Larry L and Stalter Sandy
Bought by
Collins Desiree and Collins Pauletta
Home Financials for this Owner
Home Financials are based on the most recent Mortgage that was taken out on this home.
Original Mortgage
$101,746
Interest Rate
8.1%
Mortgage Type
Balloon
Create a Home Valuation Report for This Property
The Home Valuation Report is an in-depth analysis detailing your home's value as well as a comparison with similar homes in the area
Home Values in the Area
Average Home Value in this Area
Purchase History
| Date | Buyer | Sale Price | Title Company |
|---|---|---|---|
| Stamplicker Enterprises Llc | -- | None Available | |
| Marsh Marvin M | $71,000 | None Available | |
| Deutsche Bank National Trust Co | $76,000 | None Available | |
| Collins Desiree | $119,800 | Talon Group |
Source: Public Records
Mortgage History
| Date | Status | Borrower | Loan Amount |
|---|---|---|---|
| Previous Owner | Collins Desiree | $101,746 |
Source: Public Records
Tax History Compared to Growth
Tax History
| Year | Tax Paid | Tax Assessment Tax Assessment Total Assessment is a certain percentage of the fair market value that is determined by local assessors to be the total taxable value of land and additions on the property. | Land | Improvement |
|---|---|---|---|---|
| 2024 | $3,486 | $76,060 | $13,860 | $62,200 |
| 2023 | $3,442 | $76,055 | $13,860 | $62,195 |
| 2022 | $2,541 | $47,810 | $8,050 | $39,760 |
| 2021 | $2,545 | $47,810 | $8,050 | $39,760 |
| 2020 | $2,549 | $47,810 | $8,050 | $39,760 |
| 2019 | $2,318 | $37,280 | $6,440 | $30,840 |
| 2018 | $2,177 | $37,280 | $6,440 | $30,840 |
| 2017 | $2,318 | $37,280 | $6,440 | $30,840 |
| 2016 | $2,240 | $32,970 | $5,320 | $27,650 |
| 2015 | $2,039 | $32,970 | $5,320 | $27,650 |
| 2014 | $2,044 | $32,970 | $5,320 | $27,650 |
| 2013 | $1,062 | $34,720 | $5,600 | $29,120 |
Source: Public Records
Map
Nearby Homes
- 3808 Maize Rd
- 924 Northridge Rd
- 995 Overbrook Service Dr
- 3724 Eisenhower Rd
- 1090 Pauline Ave
- 886 Carolyn Ave
- 876 Lenore Ave
- 3480 Maize Rd
- 1382 Elmore Ave
- 780 Moon Rd
- 1283 Pauline Ave
- 3941 Karl Rd Unit 326
- 1064 Hillsdale Dr
- 1279 Carolyn Ave
- 3939 Karl Rd Unit 108
- 3965 Karl Rd Unit 208
- 3967 Karl Rd Unit 125
- 1440 E Cooke Rd
- 1120 Piedmont Rd
- 1126 Piedmont Rd
- 1072 Elmore Ave
- 3797 Dorko Ct
- 1066 Elmore Ave
- 1092 Elmore Ave
- 0 Elmore Ave
- 3805 Dorko Ct
- 1060 Elmore Ave
- 1100 Elmore Ave
- 3796 Dorko Ct
- 1077 Elmore Ave
- 1071 Elmore Ave
- 3815 Dorko Ct
- 1083 Elmore Ave
- 0 Elmore Ave
- 1065 Elmore Ave
- 1089 Elmore Ave
- 3802 Dorko Ct
- 1052 Elmore Ave
- 1059 Elmore Ave
- 1108 Elmore Ave