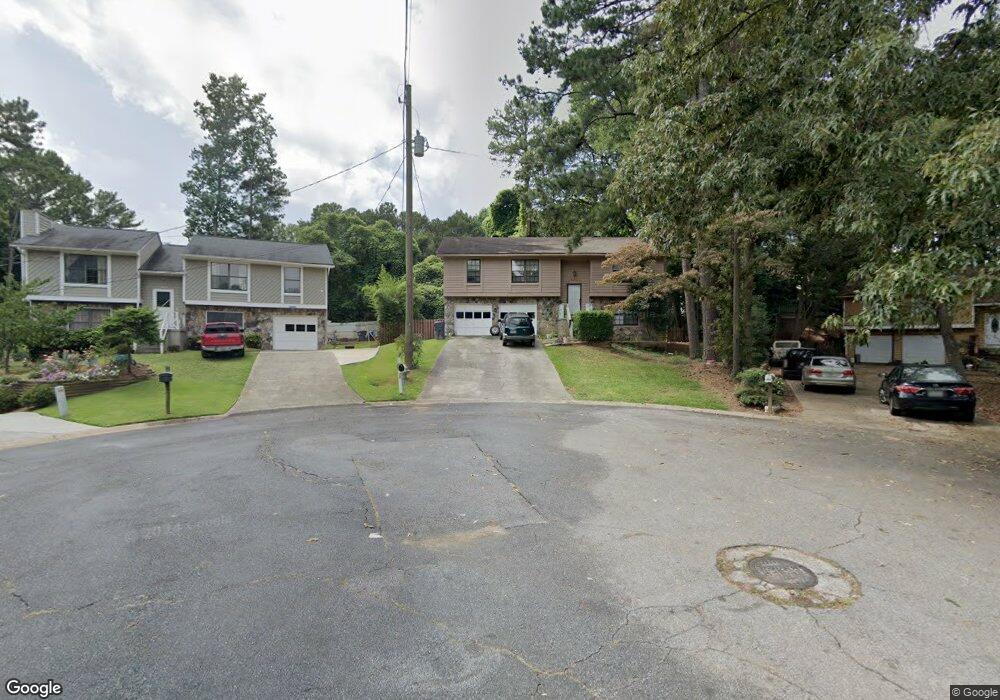
1078 Hillcrest Ct Norcross, GA 30093
Estimated Value: $319,000 - $373,000
4
Beds
3
Baths
1,830
Sq Ft
$184/Sq Ft
Est. Value
About This Home
This home is located at 1078 Hillcrest Ct, Norcross, GA 30093 and is currently estimated at $337,089, approximately $184 per square foot. 1078 Hillcrest Ct is a home located in Gwinnett County with nearby schools including Ferguson Elementary School, Louise Radloff Middle School, and Meadowcreek High School.
Ownership History
Date
Name
Owned For
Owner Type
Purchase Details
Closed on
Jan 11, 2022
Sold by
Wong Sourang
Bought by
Gwinnett County Georgia
Current Estimated Value
Purchase Details
Closed on
Aug 1, 2008
Sold by
Hud-Housing Of Urban Dev
Bought by
Wong Sourang
Purchase Details
Closed on
Nov 7, 2007
Sold by
Reyes Jose B
Bought by
Countrywide Home Loans Inc
Purchase Details
Closed on
Nov 6, 2007
Sold by
Countrywide Home Loans Inc
Bought by
Hud-Housing Of Urban Dev
Purchase Details
Closed on
Mar 15, 2007
Sold by
Deckert Edward P and Deckert Margaret H
Bought by
Reyes Jose B
Home Financials for this Owner
Home Financials are based on the most recent Mortgage that was taken out on this home.
Original Mortgage
$141,878
Interest Rate
6.3%
Mortgage Type
FHA
Purchase Details
Closed on
Sep 29, 1994
Sold by
Long Lynn Smith
Bought by
Deckert Edward P Marga
Home Financials for this Owner
Home Financials are based on the most recent Mortgage that was taken out on this home.
Original Mortgage
$88,701
Interest Rate
8.46%
Mortgage Type
FHA
Create a Home Valuation Report for This Property
The Home Valuation Report is an in-depth analysis detailing your home's value as well as a comparison with similar homes in the area
Home Values in the Area
Average Home Value in this Area
Purchase History
| Date | Buyer | Sale Price | Title Company |
|---|---|---|---|
| Gwinnett County Georgia | $3,000 | -- | |
| Gwinnett County Georgia | $3,000 | -- | |
| Wong Sourang | -- | -- | |
| Countrywide Home Loans Inc | $149,384 | -- | |
| Hud-Housing Of Urban Dev | -- | -- | |
| Reyes Jose B | $143,000 | -- | |
| Deckert Edward P Marga | $90,000 | -- |
Source: Public Records
Mortgage History
| Date | Status | Borrower | Loan Amount |
|---|---|---|---|
| Previous Owner | Reyes Jose B | $141,878 | |
| Previous Owner | Deckert Edward P Marga | $88,701 |
Source: Public Records
Tax History Compared to Growth
Tax History
| Year | Tax Paid | Tax Assessment Tax Assessment Total Assessment is a certain percentage of the fair market value that is determined by local assessors to be the total taxable value of land and additions on the property. | Land | Improvement |
|---|---|---|---|---|
| 2024 | $4,750 | $124,360 | $21,120 | $103,240 |
| 2023 | $4,750 | $111,240 | $23,200 | $88,040 |
| 2022 | $3,557 | $91,680 | $23,200 | $68,480 |
| 2021 | $2,685 | $66,240 | $13,200 | $53,040 |
| 2020 | $2,699 | $66,240 | $13,200 | $53,040 |
| 2019 | $2,293 | $57,360 | $12,400 | $44,960 |
| 2018 | $2,290 | $57,360 | $12,400 | $44,960 |
| 2016 | $1,921 | $46,320 | $9,600 | $36,720 |
| 2015 | $1,714 | $39,880 | $8,000 | $31,880 |
| 2014 | $1,505 | $33,800 | $7,200 | $26,600 |
Source: Public Records
Map
Nearby Homes
- 1037 Dover Way
- 1066 Rock Creek Ln
- 1098 Mansfield Ct
- 1089 Brittwood Place
- 1097 Rock Creek Ln
- 1090 Brittwood Place
- 1027 Mansfield Ct
- 5016 Comanche Ct NW
- 5181 Cold Springs Dr NW
- 1336 Sugarwood Ln
- 1033 Park Forest Ct NW
- 1411 Indian Way NW
- 1470 Hillcrest Rd
- 1020 Park Forest Dr NW
- 4619 Rippling Brook Ct
- 1066 Worcester Place NW Unit 4
- 862 Brandlwood Way NW Unit 2
- 5323 Sherwin Dr
- 1088 Hillcrest Ct
- 1079 Hillcrest Ct
- 1098 Hillcrest Ct
- 1089 Hillcrest Ct
- 1108 Hillcrest Ct
- 1099 Hillcrest Ct
- 1109 Hillcrest Ct
- 1118 Hillcrest Ct
- 1121 Indian Trial Rd
- 1119 Hillcrest Ct
- 1128 Hillcrest Ct
- 4966 Steve Reynolds Blvd
- 1129 Hillcrest Ct
- 1148 Hillcrest Ct
- 4956 Steve Reynolds Blvd
- 1139 Hillcrest Ct
- 4919 Cold Springs Dr NW
- 4936 Steve Reynolds Blvd
- 1149 Hillcrest Ct
- 4925 Cold Springs Dr NW