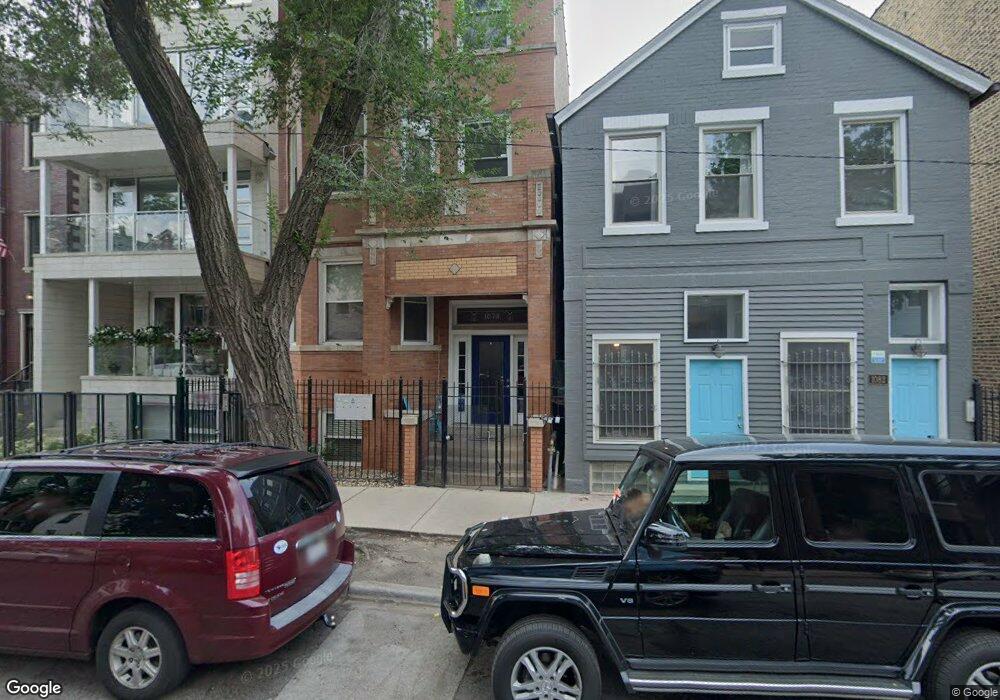
1078 N Marshfield Ave Unit P2 Chicago, IL 60622
East Village NeighborhoodEstimated Value: $326,000
--
Bed
--
Bath
--
Sq Ft
3,223
Sq Ft Lot
About This Home
This home is located at 1078 N Marshfield Ave Unit P2, Chicago, IL 60622 and is currently estimated at $326,000. 1078 N Marshfield Ave Unit P2 is a home located in Cook County with nearby schools including A.N. Pritzker School, Wells Community Academy High School, and Rowe Elementary School.
Ownership History
Date
Name
Owned For
Owner Type
Purchase Details
Closed on
Apr 12, 2024
Sold by
Hadley Andrew William and Phan-Nguyen Ba-Cuong
Bought by
Hadnguyen Living Trust and Hadley
Current Estimated Value
Purchase Details
Closed on
Aug 19, 2015
Sold by
Bykerk Jonathan and Bykerk Rachel
Bought by
Hadley Andrew William
Home Financials for this Owner
Home Financials are based on the most recent Mortgage that was taken out on this home.
Original Mortgage
$333,200
Interest Rate
3.97%
Mortgage Type
New Conventional
Purchase Details
Closed on
Nov 23, 2011
Sold by
Littleton Amy E and Adams Amy E
Bought by
Bykerk Jonathan and Bykerk Rachel
Home Financials for this Owner
Home Financials are based on the most recent Mortgage that was taken out on this home.
Original Mortgage
$308,750
Interest Rate
4.02%
Mortgage Type
New Conventional
Create a Home Valuation Report for This Property
The Home Valuation Report is an in-depth analysis detailing your home's value as well as a comparison with similar homes in the area
Home Values in the Area
Average Home Value in this Area
Purchase History
| Date | Buyer | Sale Price | Title Company |
|---|---|---|---|
| Hadnguyen Living Trust | -- | None Listed On Document | |
| Hadley Andrew William | $392,000 | Proper Title Llc | |
| Bykerk Jonathan | $325,000 | None Available |
Source: Public Records
Mortgage History
| Date | Status | Borrower | Loan Amount |
|---|---|---|---|
| Previous Owner | Hadley Andrew William | $333,200 | |
| Previous Owner | Bykerk Jonathan | $308,750 |
Source: Public Records
Tax History Compared to Growth
Tax History
| Year | Tax Paid | Tax Assessment Tax Assessment Total Assessment is a certain percentage of the fair market value that is determined by local assessors to be the total taxable value of land and additions on the property. | Land | Improvement |
|---|---|---|---|---|
| 2024 | $287 | $2,847 | $342 | $2,505 |
| 2023 | $279 | $1,359 | $134 | $1,225 |
| 2022 | $279 | $1,359 | $134 | $1,225 |
| 2021 | $273 | $1,357 | $133 | $1,224 |
| 2020 | $338 | $1,516 | $133 | $1,383 |
| 2019 | $333 | $1,657 | $133 | $1,524 |
| 2018 | $327 | $1,657 | $133 | $1,524 |
| 2017 | $394 | $1,830 | $117 | $1,713 |
| 2016 | $367 | $1,830 | $117 | $1,713 |
| 2015 | $335 | $1,830 | $117 | $1,713 |
| 2014 | $303 | $1,634 | $100 | $1,534 |
| 2013 | $297 | $1,634 | $100 | $1,534 |
Source: Public Records
Map
Nearby Homes
- 2405 W Iowa St Unit 405
- 629 N Ashland Ave
- 1035 N Hermitage Ave Unit 3
- 1636 W Augusta Blvd
- 1213 N Paulina St
- 1015 N Hermitage Ave Unit C
- 1232 N Milwaukee Ave Unit 2
- 1234 N Milwaukee Ave Unit 3
- 1057 N Wood St Unit 1
- 1222 N Paulina St
- 1258 N Milwaukee Ave Unit 3N
- 1509 W Thomas St
- 1002 N Wood St
- 878 N Marshfield Ave Unit 1
- 1013 N Honore St Unit 1
- 1215 N Greenview Ave Unit 1E
- 867 N Marshfield Ave Unit 2
- 1536 W Chestnut St Unit B
- 1019 N Wolcott Ave
- 1445 W Walton St Unit 1
- 1078 N Marshfield Ave Unit 3
- 1078 N Marshfield Ave Unit 2
- 1078 N Marshfield Ave Unit G
- 1078 N Marshfield Ave Unit 1
- 1078 N Marshfield Ave Unit C
- 1078 N Marshfield Ave Unit P1
- 1076 N Marshfield Ave Unit 3
- 1076 N Marshfield Ave Unit 2
- 1076 N Marshfield Ave Unit 1
- 1076 N Marshfield Ave
- 1074 N Marshfield Ave Unit 1
- 1074 N Marshfield Ave Unit 3
- 1074 N Marshfield Ave Unit 2
- 1084 N Marshfield Ave
- 1639 W Haddon Ave Unit 1
- 1639 W Haddon Ave Unit 2
- 1639 W Haddon Ave
- 1639 W Haddon Ave Unit 401
- 1639 W Haddon Ave Unit 104
- 1086 N Marshfield Ave Unit 1REAR