1078 Ofarrell Ct Unit 9 Salinas, CA 93907
Boronda NeighborhoodEstimated Value: $669,000 - $738,000
About This Home
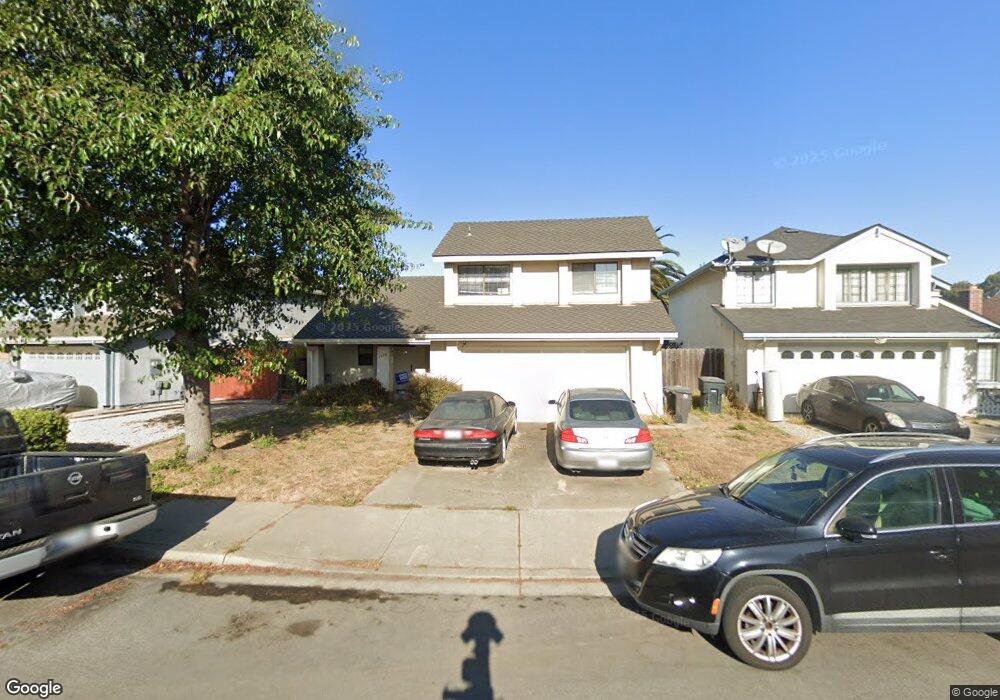
This home is located at 1078 Ofarrell Ct Unit 9, Salinas, CA 93907 and is currently estimated at $690,414, approximately $528 per square foot. 1078 Ofarrell Ct Unit 9 is a home located in Monterey County with nearby schools including Laurel Wood Elementary School, Roosevelt Elementary School, and Washington Middle School.
Ownership History
We collect this data history from publicly available records. To have your information removed, we recommend requesting removal directly through your county’s website.
Purchase Details
Home Financials for this Owner
Home Financials are based on the most recent Mortgage that was taken out on this home.Home Values in the Area
Average Home Value in this Area
Purchase History
We collect this data history from publicly available records. To have your information removed, we recommend requesting removal directly through your county’s website.
| Date | Buyer | Sale Price | Title Company |
|---|---|---|---|
| $173,000 | Old Republic Title Company |
Mortgage History
We collect this data history from publicly available records. To have your information removed, we recommend requesting removal directly through your county’s website.
| Date | Status | Borrower | Loan Amount |
|---|---|---|---|
| Open | $164,350 |
Tax History
We collect this data history from publicly available records. To have your information removed, we recommend requesting removal directly through your county’s website.
| Year | Tax Paid | Tax Assessment Tax Assessment Total Assessment is a certain percentage of the fair market value that is determined by local assessors to be the total taxable value of land and additions on the property. | Land | Improvement |
|---|---|---|---|---|
| 2025 | $3,241 | $287,367 | $99,659 | $187,708 |
| 2024 | $3,241 | $281,733 | $97,705 | $184,028 |
| 2023 | $3,130 | $276,210 | $95,790 | $180,420 |
| 2022 | $3,011 | $270,795 | $93,912 | $176,883 |
| 2021 | $2,891 | $265,486 | $92,071 | $173,415 |
| 2020 | $2,810 | $262,764 | $91,127 | $171,637 |
| 2019 | $2,788 | $257,613 | $89,341 | $168,272 |
| 2018 | $2,750 | $252,563 | $87,590 | $164,973 |
| 2017 | $2,751 | $247,612 | $85,873 | $161,739 |
| 2016 | $2,751 | $242,758 | $84,190 | $158,568 |
| 2015 | $2,774 | $239,113 | $82,926 | $156,187 |
| 2014 | $2,587 | $234,430 | $81,302 | $153,128 |
Map
- 505 Polk Cir
- 247 Arguello Dr
- 350 Victor St
- 203 Sansome St
- 230 Martella St
- 1350 Cherokee Dr
- 344 Pueblo Dr
- 23 Capitol St
- 13 E Lake St
- 746 Nacional Ct
- 24 Saint Francis Way
- 89 Clark St
- 14 Madonna Dr
- 43 Saint Brendan Way
- 410 Noice Dr
- 640 Park St
- 452 Vallejo St
- 606 Central Ave
- 1515 Aragon Cir
- 612 Central Ave
- 1074 Ofarrell Ct
- 1082 Ofarrell Ct
- 6 Geary Cir
- 1070 Ofarrell Ct
- 2 Geary Cir
- 10 Geary Cir
- 1081 Ofarrell Ct
- 1073 Ofarrell Ct
- 1066 Ofarrell Ct
- 1085 Ofarrell Ct
- 14 Geary Cir Unit 9
- 1069 Ofarrell Ct
- 18 Geary Cir
- 1062 Ofarrell Ct
- 1065 Ofarrell Ct
- 3 Geary Cir
- 1003 Ofarrell Ct
- 7 Geary Cir
- 1013 Ofarrell Ct
- 1009 Ofarrell Ct
Ask me questions while you tour the home.