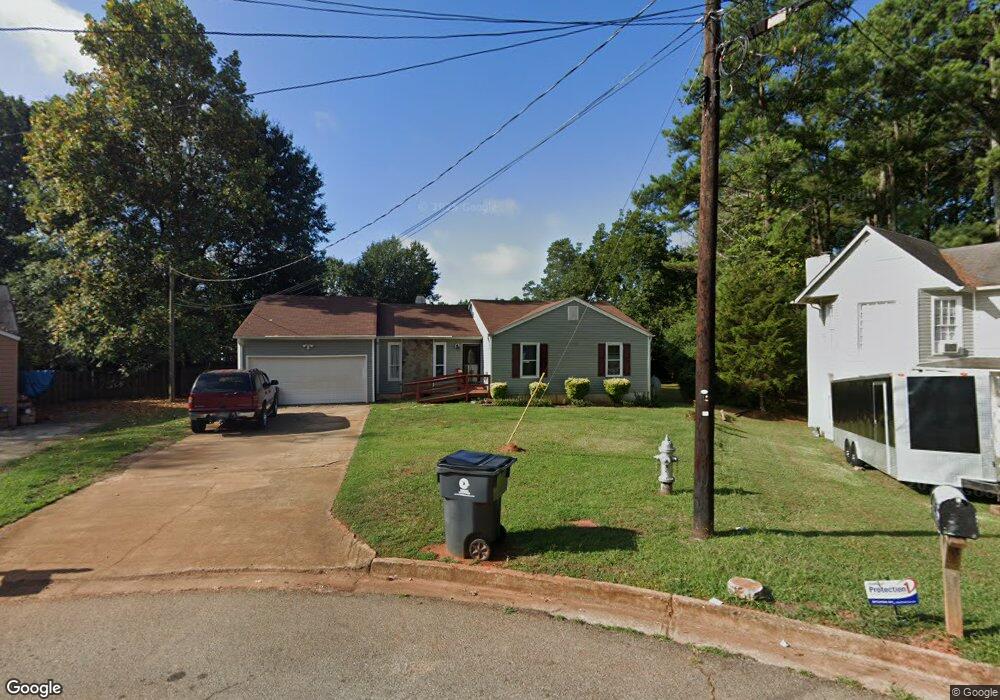
1078 Reynolds Ct Morrow, GA 30260
Estimated Value: $209,841 - $250,000
3
Beds
2
Baths
1,848
Sq Ft
$121/Sq Ft
Est. Value
About This Home
This home is located at 1078 Reynolds Ct, Morrow, GA 30260 and is currently estimated at $223,460, approximately $120 per square foot. 1078 Reynolds Ct is a home located in Clayton County with nearby schools including Lake City Elementary School, Babb Middle School, and Forest Park High School.
Ownership History
Date
Name
Owned For
Owner Type
Purchase Details
Closed on
Sep 15, 2003
Sold by
Atkinson Selena
Bought by
Evans Arnetha
Current Estimated Value
Home Financials for this Owner
Home Financials are based on the most recent Mortgage that was taken out on this home.
Original Mortgage
$117,334
Outstanding Balance
$53,405
Interest Rate
6.32%
Mortgage Type
FHA
Estimated Equity
$170,055
Purchase Details
Closed on
May 8, 2003
Sold by
Hud
Bought by
Atkinson Selena
Home Financials for this Owner
Home Financials are based on the most recent Mortgage that was taken out on this home.
Original Mortgage
$57,600
Interest Rate
5.81%
Mortgage Type
New Conventional
Purchase Details
Closed on
Jul 1, 1993
Sold by
Brazier Robert G Pamel
Bought by
Williams Esther
Home Financials for this Owner
Home Financials are based on the most recent Mortgage that was taken out on this home.
Original Mortgage
$63,318
Interest Rate
9.5%
Mortgage Type
FHA
Create a Home Valuation Report for This Property
The Home Valuation Report is an in-depth analysis detailing your home's value as well as a comparison with similar homes in the area
Home Values in the Area
Average Home Value in this Area
Purchase History
| Date | Buyer | Sale Price | Title Company |
|---|---|---|---|
| Evans Arnetha | $119,200 | -- | |
| Atkinson Selena | -- | -- | |
| Williams Esther | $8,900 | -- |
Source: Public Records
Mortgage History
| Date | Status | Borrower | Loan Amount |
|---|---|---|---|
| Open | Evans Arnetha | $117,334 | |
| Previous Owner | Atkinson Selena | $57,600 | |
| Previous Owner | Williams Esther | $63,318 |
Source: Public Records
Tax History
| Year | Tax Paid | Tax Assessment Tax Assessment Total Assessment is a certain percentage of the fair market value that is determined by local assessors to be the total taxable value of land and additions on the property. | Land | Improvement |
|---|---|---|---|---|
| 2025 | $2,302 | $69,200 | $4,844 | $64,356 |
| 2024 | $2,345 | $69,200 | $4,844 | $64,356 |
| 2023 | $2,511 | $103,560 | $7,200 | $96,360 |
| 2022 | $2,371 | $7,200 | $7,200 | $62,334 |
| 2021 | $1,694 | $52,000 | $7,200 | $44,800 |
| 2020 | $973 | $33,459 | $7,200 | $26,259 |
| 2019 | $781 | $28,370 | $4,800 | $23,570 |
| 2018 | $584 | $23,513 | $4,800 | $18,713 |
| 2017 | $746 | $27,476 | $4,800 | $22,676 |
| 2016 | $739 | $27,293 | $4,800 | $22,493 |
| 2015 | $385 | $0 | $0 | $0 |
| 2014 | $441 | $20,186 | $5,600 | $14,586 |
Source: Public Records
Map
Nearby Homes
- 1058 Phillips Cir
- 5647 Highland St
- 5489 Ahyoka Dr
- 1241 Tsali Trail
- 965 Cone Rd
- 5535 Cypress Dr
- 5570 Ash St
- 1124 Ponderosa Park Dr
- 0 Ash St Unit 10563129
- 740 Patricia Dr
- 1140 Foxcroft Dr
- 913 Longleaf Dr
- 1077 Helen St
- 5729 Jefferson Ave
- 5316 Ash St
- 880 White Oak Dr
- 5344 Sharon St
- 927 Slash Pine Rd
- 5355 Sharon St
- 5179 Laurel Cir
- 1082 Reynolds Ct
- 1096 Pine Meadows Dr
- 1077 Reynolds Ct
- 1077 Reynolds Ct Unit 39
- 1077 Reynolds Ct
- 1088 Pine Meadows Dr
- 1104 Pine Meadows Dr Unit 3
- 1080 Pine Meadows Dr
- 1086 Reynolds Ct
- 5610 Phillips Dr
- 5602 Phillips Dr
- 1081 Reynolds Ct
- 5620 Phillips Dr
- 1112 Pine Meadows Dr Unit III
- 1089 Reynolds Ct Unit IV
- 5596 Phillips Dr
- 1090 Reynolds Ct
- 5630 Phillips Dr
- 5590 Phillips Dr
- 1126 Pine Meadows Dr
Your Personal Tour Guide
Ask me questions while you tour the home.